“Design and Analysis of Improvisation in Cancer detection technique in Patients using Machine learning”
¹Ravi Kumar Jangid , ²Prateek Singh
¹Research Scholar , ²Head
Center for cloud infrastructure and security
Suresh Gyan Vihar University, Jaipur
ravijangid207@gmail.com, prateek.singh@mygyanvihar.com
Abstract— Hospital supervision or healthcare administration is the field with reference to management, leadership and administration of hospitals, health care systems and hospital networks. Healthcare business these days generates huge amounts of complicated information concerning with patients, medical devices, electronic patient records and sickness designation, hospital resources etc. this paper explores the Machine Learning applications, challenges and some future directions in health care. In particular, it discusses Machine Learning and its applications within healthcare in major areas. This hospital based survey also explores utilities of various Machine Learning techniques such as Association Rule, Clustering and Classification in the healthcare domain. This thesis also defines the cancer side and the morphology pattern among various patients of Gujarat with the help of above defined Machine Learning techniques.
Keywords—Healthcare, Hospital, Machine Learning, Hidden patterns, Association rule, Classification.
1 INTRODUCTION
The healthcare market in India is one of the largest and fastest growing industry in the world, it consume nearly 10 per cent of the GDP (Gross Domestic Product) most of the developed or developing nation, healthcare industry contribute a major part for a country’s economy. The Indian healthcare sector, one of the fastest growing industries, is expected to outstrip at a compound annual growth rate (CAGR) of 17 per cent during 2011-2020 to reach US$ 280 billion. It is expected to rank amongst the top three healthcare markets in terms of incremental growth by 2020. . Indian Healthcare sector provides new and existing players with an only one and special opportunity to achieve and perform innovative research and profits. Healthcare in India also awarded as ’polio Free’ country by World Health Organization (WHO). In last few year Indian healthcare sector is growing very very fast and according to McKinsey & Company it is estimated to be worth US$100 billion by 2019 Of total healthcare revenues in the country, hospitals account for 71 percent, pharmaceuticals for 13 percent and medical equipment and supplies for 9 percent .If the Indian economy grows faster than the economies of the developed nations and education rate keeps on increasing, then much of the Indian will be middle class by 2020.And the Middle class can afford quality health. According to CII study India needs 50 billion dollars annually to fulfill the health care requirement for the next 20 years, till 2027 India needs 2 million beds, and requires immediate investment of 82 billion dollars. According to PWC 60% of patients are outpatients in private sector. Nearly 40 percent of hospital beds are present private sector. Around 30 percent of the medical market is covered by economy segment.
1.2 MACHINE LEARNING ALGORITHM
Machine learning is a set of techniques that are part of intelligence artificial, which based on algorithms seek learning within large sets of data. A very important feature of these algorithms is the prediction of new cases based on the experience learned from the data set used for their training, this is known in the literature as generalization ( Fernández, 2003 ), ( Beltrán, 2008 ). Within the literature (García, García, 20017), (Freitas, 2012), ( García, Quintales, García Peñalvo, Martín ) we found that machine learning is divided usually in two types, “supervised” learning where each of the observations or samples of the data set have a variable or data related which indicates what happened, what happened, that is the entries are labeled. This type Learning is subdivided into classification and regression. In classification the outputs of the system are finite and discrete and are interpreted as the class to which it belongs, example “0” or “1”, “False” or “True”, “Yes” or “No”, while in the regression, the Departures are continuous. In this research we focus on the type of learning supervised-
1.3 TYPES OF MACHINE LEARNING
The other type of learning is “Unsupervised”, in this type of learning, in the data set data are available for training but it is not known or not has the output or very little is known about this, that is, there is no variable objective and what is required is to look for patterns. To determine what you want to predict you can find structures on the data, within these structures you can mention clustering (process of partitioning a data set into a set of significant subclasses called groups) and association (feature set significant).
Frequently, machine learning experts recommend the construction of models, separate the dataset into a subset for training, validation and test. With the separate data sets for training and testing, the model with lower validation error and the test data set is used to Try the best model found. Within the techniques found for training and validation, the use of Cross Validation is proposed in the literature ( Refaelizadeh, Tang, Liu, 2008) , a technique used to evaluate the results obtained in the analysis performed Cross validation is divided into three types; the first, validation Crusade k Fold, consists of dividing the training set into k parts. One of the parts are used as test data and the remaining k-1 as training data, this process is repeated k iterations and in the end the arithmetic mean of the results of each iteration and only one result is obtained. The second type of validation found is random and consists of randomly dividing the data set of test. The third type of cross validation is Leave one out, it consists in separating a Sample data set for validation and the rest is used for the training, this process is repeated according to the number of samples you have.
According to experts within the process of choosing the ideal model they should be taken into It counts the complexity and the measure of error of the same, contemplating the bias and the variance The errors that are determined to evaluate learning are the “error of training ”and“ validation error ”and are calculated on the set destined for such end. In the literature ( Liu, Huan, 2005 ), (Morelli, 2013), Fernández, et al. (2003), Beltran et to the. (2008) it is shown that when we have a low training error and an error in training of high validation there was an error due to variance, that is to say an over fitting is had understand that the algorithm over-adjusted training data and learned from noise content in the sample and therefore the generalization of the model probably fails.
When you have a high training error and a low validation error you have a problem by bias that is underfiting. The indicated thing is to look for an optimum level where decide the complexity of the model according to the available data and not according with the complexity of the function that the researcher supposes. For the search of an optimal level literature offers regularization strategies, which is a way of penalize the objective function to prevent it from deviating for those outliers and aberrant Regularization aims to make an appropriate exchange between the reliability of training data and the benefits of the model. In supervised learning procedures, the exchange is done through the minimization of total risk (Haikyn, 1999).
Another important issue that should be clear due to its importance of application in the techniques Machine Learning is the “Principal Component Analysis”, it is a technique multivariable statistics, developed by the Frenchman Benzecri (1980) that allows reducing the dimensionality of a set of data, transforming the set of “p” variables originals in another set of “q” incorrect variables (q≤p) calls main components. The p variables are measured on each of the n individuals, obtaining a matrix of data of order nq (Vieyra, 2013) (Sellero, 2008). The method consists of looking for linear combinations of the original variables that best represent the variability present in the data. In this way, with a few linear combinations, which will be the main components, would be enough to understand the information contained in the data (Otero, 2008)
- Review of Literature
In last chapter, we have discussed about various Machine Learning fields. It includes, medical services in India, Machine Learning in healthcare context, issues and challenges in health care Machine Learning, Machine Learning application in cancer treatments, and various applications also. Now in this chapter, the discussions points are past and present work of Machine Learning researchers. We will discuss about the research works in the field of Machine Learning in health care industry. In first section of the chapter, review process is described. This covers the publication year range of papers that I have studied and how I conduct my review. Moving to the next section, which consists of the summary of all the papers that I have studied to perform experiments and achieve objective. This section is further divided into various categories based on the solutions in the field of our objective. Third section is about the solution approaches by various researchers. Then in section 4, discussion will be on the strengths and weaknesses which I have observed after studying various papers and already mentioned by them in their papers. Last section covers the summary of all the papers.
In 2012 Patil, D.D.[2] presents an innovative wireless sensor network which helps to provide online health prediction by monitoring real time vital body signals. For implementation and result they applied clustering algorithm (Graph theoretic, K-means) on patient historical data. They use the comparative analysis on vital signals originate by the clustering algorithms which adds extra dimension to risk alert which helps doctor to diagnose more accurately. In 2012 Carel,Rafael and et.al [3] construct a predictive model for asthma drug utilization by applying methods of KDD in time series databases to historical asthma drug dataset. They applied clustering and decision tree algorithm on regional patients’ database. The results shows 274 asthma patients receives 9,319 prescriptions and classification shows that the corticosteroids medications is the main predictive factoring the model.
- Method and Material
3.1 STEPS INVOLVED IN DESIGNING THE RESEARCH WORK
Initially Data is extracted, transform and load from the transaction database into Data-Warehouse as shown in fig2. After extracting data into electronic machine following tasks will be performed.
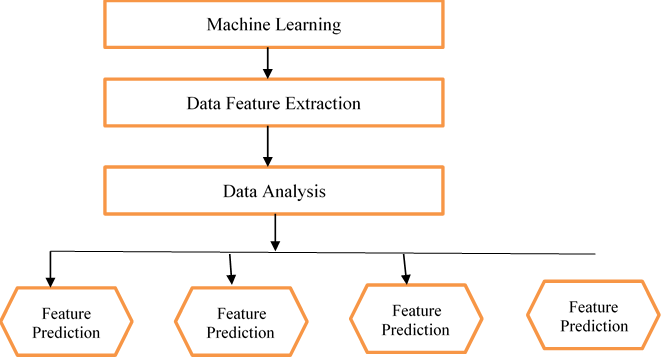
Fig 3.1: Basic concept of Machine Learning
3.2 HEALTH-CARE BUSINESS UNDERSTANDING
Health-Care Business Understanding provide by study various type of research paper related to health care and by understanding health-care data. This Phase concentrates on understanding health-care project objective and various requirements.
I. Medical-Data Understanding:
This phase starts with collection of health care data from Laboratories, Operation Theater, Blood Bank, drug store, Therapy Modules etc., and also focuses on understanding of patient’s data to discover knowledge out of it to generate HMIS repots.
II. Medical-Data Preparation:
This phase constructs final data set to feed into modeling tools and it is iterative process. Here various database artifacts such as attribute, table, records are selected as well as transformed and cleaned for modeling tools.
III. Medical-Data Preparation:
This phase apply various modeling techniques such as Naive Bays, Artificial neural network, decision tree, time series algorithm, clustering algorithm, sequence clustering algorithm etc.. to generate optimal values.
IV. Evaluation:
In this stage thorough evaluation and reviewing the model to check whether applied algorithms discovers proper hidden pattern. And this stage also checks for fast accessing on mined data.
V. Deployment:
In this phase most of the time customer carry out the deployment wizard with the help of analyst to generate HMIS reports. For generating useful knowledge out of data i.e. reports we can repeat Machine Learning process.
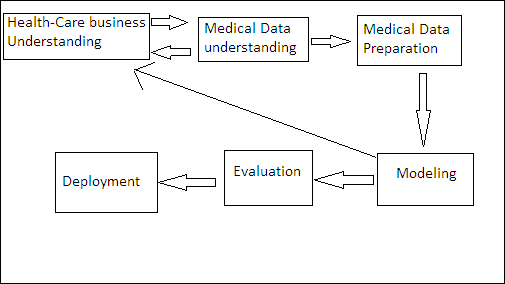
Fig 3.2: Health care business cycle
4. Methodologies/Algorithms used for experiment
4.1 NAIVE BAYES ALGORITHM:
It is a classification based algorithm based on bayes theorem. It is used for predictive modeling. We are using this algorithm very frequently for quick generation of mining model to discover relation between input and predictable columns. We can use this model for initial exploration of data.
How the Algorithm Works:
It will calculate the probability of each state of input column and produces each possible state for predictable column.
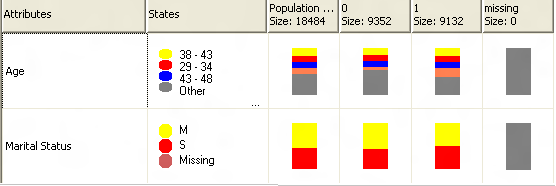
Fig 4.3: Naive Bayes algorithm output screen
Data Required for Naive Bayes Models:
- Key column: Each model should contain one primary
- Input columns: Input column must be either discrete or continuous and they should be independent of each
- Predictable column: There should be one predictable attribute which must contain continuous or discrete
4.2 CLUSTERING ALGORITHM:
It is a segmentation algorithm which uses iterative techniques to make clusters which contains similar type of characteristics. These clustering are useful for finding similar objects in data for prediction.
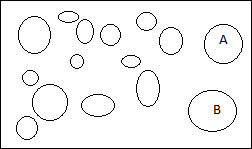
Fig 4.4: How cluster looks like
How the Algorithm Works:
Clustering algorithm primarily identifies the relations in the dataset and generates clusters based on that relationship.
We can visualize the grouped data by scatter plotter. Each scatter plot represents cases in data set.
Data Required for Naive Bayes Models:
- A single key column: The model should contain primary
- Input columns: Each model should contain one input
- Predictable column: This column is optional field in the
4.2 CLUSTERING ALGORITHM:
It combines each possible input attribute to each possible state of the predictable attribute. And will use the training data to get the probability. Then this probability will be used for classification or regression.
A Machine Learning model which is constructed from Neural Network algorithm will contains multiple networks, depending on the input and predictable column. The no. of. Networks present in mining model depends on the number of states present (input columns and predictable columns) in that.
How the Algorithm Works:
The neural network algorithm contains three layers of neurons in a network which is created by this algorithm. These three layers contain input output layer and an optional hidden layer.
Input layer: It defines all the input attribute values and their probabilities for Machine Learning model
Hidden layer: It receives input from input neuron and provides output to output neuron. This layer present where the various inputs are assign to weights. Weight will defines the particular input to the hidden neuron. Input importance is depending on the weight, greater the weight more important will be its value. Weight can be negative and in this case input will be neglected.
Output layer: It represents predictable attributes value for the mining model. Data requirement for neural network: It should contain one key column, one or more predictable and input column.
Mining model which use the Neural Network algorithm are depends on values which we define for the parameters that are available to the algorithm.
This parameter defines how data is sampled, distributed or expected to be distributed in every column.
4.3 TIME SERIES ALGORITHM:
This algorithm uses regression technique which is optimized for the forecasting of continuous values. This algorithm does not required additional column for predicting trends like decision tree.
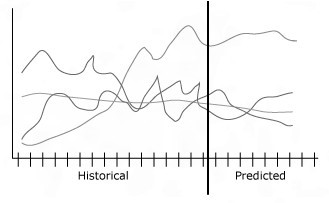
Fig 4.5: Time Series trends
Historical information represents the data which is used to create the model and it is represented on left vertical in the above dig. Predicted information represents the forecasting of the model and it appears at the right of the vertical. Combination of prediction and source data is called series.
An important feature of time Series algorithm is that it can perform cross prediction. If you give two separate but related series, we can result it as one series based on the behavior of the other series.
CONCLUSION
Health issues are arising fast in this era. Scientists are running behind the technologies to find best to best solutions for diseases. Machine Learning is one of the best solutions to treat patients with the help of past experiences and knowledge extracted from the data collected in previous years. Machine Learning has a great impact in the field of health care. Heath care industries are improving their outputs with the use of various techniques and equipment’s developed by medical scientists.
In this thesis, we propose to carry out cancer side and the morphology pattern among various patients in context of complex data like texts, images, sounds and videos. In our approach we combine OLAP with Machine Learning which result high level of analysis, which helps in discovering hidden pattern in data and reporting helps in information visualization. We also explore challenges and application of Machine Learning in health care.
We tried to put our best efforts in performing experiments for the achievement of objectives. Results discussed in this thesis may be proved useful in some other researchers and we would also like to enhance this research work as mentioned in the future planning.
References:
- Shweta Kharya discussed, “USING MACHINE LEARNING TECHNIQUES FOR DIAGNOSIS AND PROGNOSIS OF CANCER DISEASE”, International Journal of Computer Science, Engineering and Information Technology (IJCSEIT), 2(2), (2012)
- Patil, D., “Dynamic Machine Learning approach to WMRHM”, 7th IEEE Conference on Industrial Electronics and Applications (ICIEA), Singapore, 978, (2012)
- Carel, Rafael and Barak, Dotan, “Utilization of Data-Mining Techniques for Evaluation of Patterns of Asthma Drugs Use by Ambulatory Patients in a Large Health Maintenance Organization”, Seventh IEEE International Conference on Machine Learning Workshops, 2007. ICDM Workshops, Omaha, NE, USA, 169 – 174, (2007)
- Reyes,A.J.O.;Garcia,A.O.;Mue,Y.L. “System for Processing and Analysis of Information Using Clustering Technique”, Latin America Transactions, IEEE (Revista IEEE America Latina) 12( 2 ), 364 – 371, (2014).
- Goil, And Choudhary, A., “A parallel scalable infrastructure for OLAP and Machine Learning”, International Symposium Proceedings on Database Engineering and Applications, IDEAS ’99, Montreal, Que, 178 – 186, (1999)
- Balasubramanian T. , “An analysis on the impact of fluoride in human health (dental) using clustering Machine Learning technique”, IEEE International Conference on Pattern Recognition, Informatics and Medical Engineering (PRIME)”, Salem, Tamilnadu, 370 – 375, (2012)
- Ada and Rajneet Kaur, “A Study of Detection of Lung Cancer Using Machine Learning Classification Techniques”, International Journal of Advanced Research in Computer Science and Software Engineering, 3(3), (2013)
- Abdelghani Bellaachia, Erhan Guven, “Predicting Breast Cancer Survivability Using Machine Learning Techniques”, Department of Computer Science The George Washington University Washington DC available at eguven@gwu.edu
- Kawsar Ahmed, Abdullah-Al-Emran, TasnubaJesmin, Roushney Fatima Mukti, MdZamilurRahman, Farzana Ahmed, “ Early Detection of Lung Cancer Risk Using Machine Learning”, Asian Pacific Journal of Cancer Prevention, 14, (2013)
- Krishnaiah, Dr.G.Narsimha, Dr.N.Subhash Chandra “Diagnosis of Lung Cancer Prediction System Using Machine Learning Classification Techniques”, International Journal of Computer Science and Information Technologies,Vol. 4 (1), 39 – 45 (2013)
- Ruben D. and Canlas Jr. “Machine Learning in Healthcare: Current Applications and Issues”, (2009)
- Bellazzi, R. ” Methods and tools for mining multivariate temporal data in clinical and biomedical applications” IEEE, 5629 – 5632, (2009)
[13]P.Santhi, V.MuraliBhaskaran, “Performance of Clustering Algorithms in Healthcare Database”, International Journal for Advances in Computer Science, 2(1), (2010)
- Sung Ho Ha and SeongHyeonJoo, “A Hybrid Machine Learning Method for the Medical Classification of Chest Pain”, World Academy of Science, Engineering and Technology, 4, (2010)
- Hemalatha M. and Megala S., “Mining Techniques in Health Care: A Survey of Immunization”, Little Lion Scientific R&D, 25(2), 63-70, (2012)
- Al Iqbal, R. “Hybrid clinical decision support system: An automated diagnostic system for rural Bangladesh”, IEEE, Dhaka, 76 – 81, (2012) .
- Xylogiannopoulos, “Developing an Efficient Health Clinical Application: IIOP Distributed Objects Framework”, International Conference on Advances in Social Networks Analysis and Mining, Istanbul Turkey, (2012)
- Akay, Dragomir, and B-E Erlandsson,