1Sumit Singh
1Suresh Gyan Vihar University,Jaipur
ABSTRACT -India is an agricultural country. For economical purpose there is depends on agriculture. Now these days WSN technology is rapidly increase in many fields. The recent advantage in Wireless field, there is developing many sensors that can be used to monitoring the health and environment. In last few years there have been tremendous advancements in technology for agriculture and growth of final yield. Environmental monitoring is achieved by using small sensors nodes.
I. INTRODUCTION
India is an agricultural country and agriculture is the largest sector of the Indian economy. We are directly and indirectly depend on agriculture. Mainly we export their many things in other countries these are direct related to our agricultural but some previous years there is many changes in our environment. It’s direct effect on our agriculture and it’s indirect effect on our economy growth. We need to be very careful from the initial stage to get maximum quantity and good quality of product and reduce the cost of production. We enhance the quantity and latest technologies can help. This technology can help farmers to monitor crops efficiently and to get accurate information about their field.
We believe that WSN technology could help the farmers to monitor different types of parameter timely and cost effectively. There have been several studies of Wireless Sensor Network in agriculture for general parameter monitoring. A wireless sensor network (WSN) generally consists of a large number of low-cost and low-power sensor nodes. In WSN, the nodes connect wirelessly short term distances and capable of These sensors are connect with base sensor and make a tree topology. Tree topology consists of two sensor nodes. The sensor nodes consisted of a temperature sensor, light sensor, humidity control, water level sensor a GPS module and a ZigBee wireless transmitter packaged together. The GPS module is give the information about the location of the sensors.
organizing themselves in an autonomous multi-hop mesh network. It may detect the environment enabling interaction between farmers or computers and the surrounding environment. The application of WSN for environmental monitoring has been studied in the literature. Like as, WSN were used to gather forest temp, data and the amount of rainfall. Wireless sensor network (WSN) has to be very helpful in specific applications requiring monitoring of real time data. The wireless sensor devices can automatically organize themselves to form an ad-hoc multi hop network.
Wireless sensor networks (WSNs), comprised by hundreds or maybe thousands of ad-hoc sensor node devices, working together to accomplish a common task. This design constrains are related with the purpose and the characteristics of the installation environment. The environment determines the size of the network, the deployment method and the network topology. Resources constrains are imposed by small communication range, low throughput and reduced storage and computing resources. This research paper give a review on wireless sensor networks solutions to environmental monitoring applications. This network consists of two sensor nodes and a base station. This ZigBee wireless communication module, based on IEEE 802.15.4, is used as the wireless communication unit in the sensor nodes. ZigBee is selected as it is a low-cost and low-power than bluetooth and it has been shown to be a many viable technology for sensor applications devices. These wireless modules are easy to install and capable for point-to-point, multipoint and convertible to a mesh network. The captured data is made shown off to the farmers (users) through a graphic application programming interface (API).
This designed network is capable for the monitoring of temperature and greenhouse gases in warehouses and factory settings. This paper provide a review as follows. In Section II, present the wireless sensor network’s architecture, including details on the transmitter and the receiving node structures. The data and experimental results are presented in Section III. Finally, the conclusions are given in Section IV.
II. NETWORK ARCHITECTURE
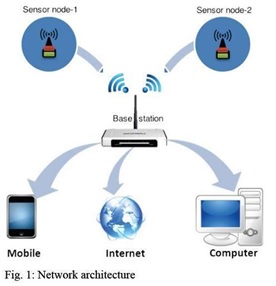
The WSN (Wireless Sensor Network) was implemented a mash topology in beacon mode. The proposed WSN architecture is shown in fig. two individual sensor nodes serve as transmitters have been designed to collect the data, process, and transmit the temperature, and the sensor’s location
signals in real time. This network operates within a range up to 100meter from the base station to end sensor. It is perfect for monitoring the concentration of greenhouse gases inside. Wireless Sensor Networks is a spatially distributed to monitoring physical and environmental parameters. More modern these sensor networks are use for both side and enabling control of sensor activity. This model is the base upon an agricultural concept consisting of no. of control sensors in it. It could be use in a greenhouse. In this paper five different parameters are described along with the communication between two greenhouse models. The block architecture, circuit diagram and other necessary diagrams are shown. GPS module concept for receiving information from greenhouse models for comparing their readings for better productivity is also done. These five different types of parameters such as temperature, humidity, light, water level and soil are measured one after another and displayed on LCD. If an end user residing far away from the farm field wants to check the readings of different parameters. In addition to data integration and analysis, the base station also relays processed data to display devices and PDAs. This base station is equipped with an Arduino Uno Microcontroller for system coordination, a receiving ZigBee module and a Wi-Fi 33 module for communication and data Transmission over the 802.11b/g wireless communication, which make it possible to access the collected data via the Internet. In addition, the captured data is inserted into a MySQL database where a webpage with a graphing application programming interface (API) is used to display the data.
 A. Transmitter Node– To get a power efficient networks, open source and low-energy consumption hardware devices were used to install the transmitter. The figure of the transmitting nodes and the final product are shown in Fig. 2(a) and Fig. 2(b), respectively. Every transmitting nodes focus of one off-the shelf ZigBee wireless module, greenhouse gas sensors, temperature sensor, and a GPS module. The ZigBee wireless module operates on the at a frequency of 2.4GHz with a power output of 1mW and a data transmission rate of 250kbps, which ensures the wireless nature of the network. Zigbee is less expensive than Bluetooth. It covers short distance area. There is many sensors connect with transmitter node like as temp sensor, light sensor, humidity sensor, water level. A TMP36 analog temp sensor with a voltage o/p of 1.75V at 125°C is used to control the temp. There is used to GTPA013 ultimate GPS module with a – 165dBms sensitivity. It is only 20mA current draw is added to the transmitter node. Than this module determines the exact location of the sensor node at all time. From last few years we were used to 9 volt battery but this was not renewable and there was problem with maintenance. Now this time in this project there is use solar energy. This is renewable energy source. There is use anArduino controller. This program is consist in transmitter node. This Arduino open source environment was used to where the C++ programming language was used.
The function of the transmitter node is explain below:
- Collect the continuous and real time sensor information from every sensor.
- Transmit the processed information to the base station periodically for further view and display it.
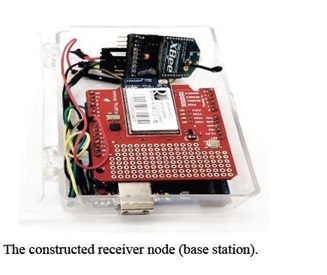
B. Base Station-
This base station was constructed from low power consumption hardware. Base station constructed shown in fig. ZigBee wireless module, operate on the IEEE 802.15.4 protocol at a frequency of 2.4 GHz and a power o/p of 1mW was used as the wireless module.
The works of the base station are shown in below:
- Coordinate the two transmitting nodes by sending periodic data requests.
- Receive environmental information from all transmitting nodes in real time.
- Relay the received information to display devices for a remote visualization.
Temperature sensor (LM 35)
A pragmatic approach to resolve the problems related to crops is through LM35. We can determine temperature more correctly than using a thermostat. The LM35 produce a higher output voltage than thermocouples and may not need that the output voltage be amplified.
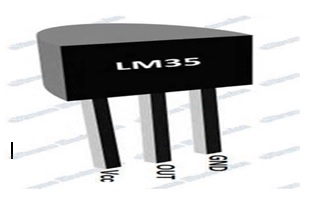
As the scale factor of LM35 is 0.1v/oc. It makes only 60 microamperes from its supply a low self-heating capability. The first pin is of +5v which provides the power supply to the sensor node and the second pin is for output that is connected to the port A of at mega 16 on 40th pin. The third pin is for ground to make complete the circuit. As the circuit is completed the temperature sensor senses the temp and shows it on LCD. As per the programming the threshold is fix on the values of temperature that is 20o-30o C. As whenever the temperature increases continuously from threshold the fans connected through relay starts and it automatically decreases the temp that is very useful in the growth of crops.
Light sensor:-
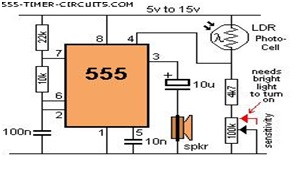
Light sensor has been constructed by using LDR and 555timer. Light sensor is used to determine the light necessary for growth of crops.
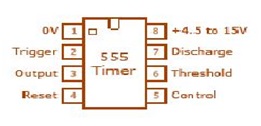
This combined light sensor circuit detects light falling on the LDR (photocell) to turn on the 555 timer. Pin 4 of 555 timers held below 0.7V to turn the 555 off, voltage above 0.7V will activate the circuit. The adjective sensitivity control is required to set the level of voltage.
An LDR must be able to detect large amount of light. As the resistance of the LDR decreases, the voltage across the 555 will increase and circuit gets activated. When the circuit takes activate, sensor detect the presence or absence of light in the field. It is actually determine whether it is night or day. If the light intent falling on LDR, it will indicate day on LCD and the bulb will remain off. But if the light intensity is not sufficient it will indicate night on LCD and bulb will be ON. The output of this mixed circuit sensor is connected to the microcontroller. Absence or presence of light will be displayed on the LCD screen.
LDR circuit diagram
Humidity control sensor
As we are determining the parameters for agricultural crops, Humidity is one of the main focuses for growing crops in different types of conditions all over the months. It fluctuates in every day depending on the atmosphere situation. So we need to be very careful while measuring it. For this motto HSM 20G sensors is used for detect Humidity. It will provide information in digital form.
The tasking of HSM 20G is totally based on the programming. This programming could be designed as per the needed crop to grow under certain humidity situation. The graph for this should be linear.
HSM 20G, the humidity sensor is used determine humidity as well as temperature. But, we are using it to determine only the humidity. The sensor is composed of 4 pins that are named as are 1, 2, 3 & 4 The first pin is for temperature detecting. This pin doesn’t taken in use and so it is left as it is. The next second pin is grounded. The third next pin is for determine humidity. This pin is attached to at mega 16 at 2nd pin of port A. The last fourth pin is joined to the 5V power supply.
The second pin detect the humidity level present in the atmospheres and converts it to percentage form readable and understandable by the user. The sensor is programmed internally to function as per needed in the fields. The range for this sensor is set between 20% to 49%. The reading between these ranges is considered normal. But if the reading extends the fix range then the display will read critical. This means that the range is not suitable for growing crops and suitable steps should be taken to reduce or increase humidity level as per needed.
Humidity sensor (HSM 20G)
Water level:
For this network three wires are used to determine the level of water in soil. One wire is installing deep in the soil. Another wire is fixed in mid level of soil. The last wire is fixed almost on the top part of soil. These three wires will determine different layers of the water present in soil. As the layers of water decreases, water motor can be started.
III. Experiment and data Analysis
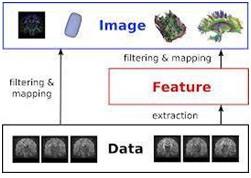
Feature Extraction
Feature extraction involves simplifying the amount of resources required to describe a large set of data accurately. When performing analysis of complex data one of the major problems stems from the number of variables involved.
Feature Extraction
COLOUR PROCESSING
Colour of an organic material gives vital information about that material. Colour Features Colour analysis in this project is based on the RGB Colour Space and HSI colour spaces.
RGB Colour Space:
This colour space is commonly used and human eye can also perceive it. The colour of any object is made from three primary colours these are Red, Green and Blue. Other colours are made from primary colours that is, the mixture of 2 or more primary colour gives the full colour spectrum. RGB colour space based on the primary spectral components of red (R), green (G) and blue (B).
HSI Colour Space:
HSI that is hue (H), saturation (S) and intensity (I) gives the colour description in terms that are practical for human interpretation. Hue, Saturation and Intensity of the colour objects are perceived and described by human eye. Hue gives the measure of distinct colour of the spectrum such as red, green, yellow etc. Saturation is a measure of the degree to which pure colour is diluted by white light that is richness of pure colour. Intensity is the brightness subjective descriptor and impossible to measure. The Intensity of HSI model decouples the intensity component from the colour carrying information (hue and saturation) in a colour image [19]. HSI is the gives the best results and compared to RGB colour system because in RGB colour system provide three separate coordinates RED, GREEN and BLUE which is not efficient for colour perception and image processing than compared to HSI mode. Whereas in HIS modal only hue (h) can give the colour perception. As a result HIS model is known as the most ideal tool for developing image processing algorithms [19].
Hence it is proved that HSI is efficient in examining of organic products and other coloured objects because
- HIS models can separate intensity from the colour information which gives chromatic purity of the coloured object
- Hue and Saturation components are intimately related to the way in which human being perceive colour.
- Hue of the colour does not depends upon the light intensity
A. FEATURE EXTRACTION AND FORMULA USED FOR CALCULATIONS
Here we are extracting the Red, Green and Blue colour from the wheat crop image and predicting the age of wheat crop. As mentioned above the percentage of green colour in the wheat crop vanishes with its age. Firstly, we are calculating the percentage of green colour in the image of wheat crop. After calculating the percentage of green colour present in the image in RGB colour system, we are converting the RGB colour system into HSI that is, Hue, and Saturation and Intensity foe better prediction. RGB data is first converted into HSI data. With image representation in the HSI domain, the colour analysis was based on primarily the Hue value. Hue is a colour attribute that describes a pure colour, whereas saturation gives a measure of the degree to which a pure colour is diluted by white light and finally intensity gives the effectiveness of the colour. The three Dimensional RGB space is reduced to a one-dimensional „H‟ Space for colour analysis. For a Digitized colour image, the Hue histogram represented the colour components and the amount of that Hue in the image. In this paper we are taking three images (Image1, Image2, Image3) or wheat crop at different instances of time. The Image1 is taken after 6 weak of sowing wheat. Image2 is taken after 14 months of sowing and the Image3 is taken after 18months older. The wheat crop requirement changes with the time and at the age 6, 14 and 18 weeks the crop show maximum transition in the requirement. So, by knowing this development phase of wheat crop farmer can cultivate better yield.
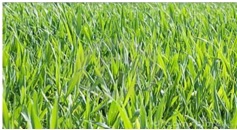
Fig1:Image1 (6 Weak older wheat crop)
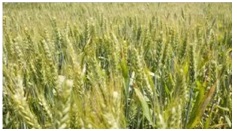
Fig2:Image2 (14 weak older wheat crop)
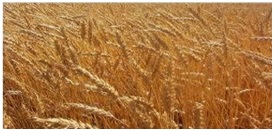
Fig3:Imgae3(18 weak older wheat crop)
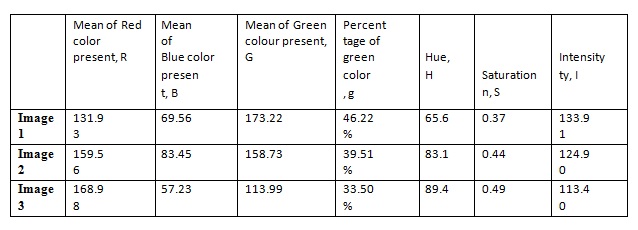
Mean of Red, Green and Blue colour components obtained by using Digital image processing in MATLAB. Mean of Red, Mean of Green and Mean of Blue colour components is represented as R, G and B respectively. This computation helps to comprehend the most dominant primary colour of the image.
B. Percentage of Green colour in RGB modal,
![]()
RGB colour system is converted to HSI colour system by using following formulas. Given an image in RGB format, the Hue component of each RGB pixel is given by
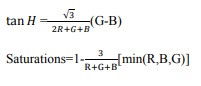
Intensity I=13(R+G+B)
Function Used in Matlab for RGB value
function Io = gab2d(I,sigmax,sigmay,u,v)
m=fix(sigmax);
n=fix(sigmay);
for x=-m:m
for y=-n:n
t=((x*x)/(sigmax*sigmax))+((y*y)/(sigmay*sigmay));
t=(exp(-0.5*t))/(2*pi*sigmax*sigmay);
gfr(m+x+1,n+y+1)=t*cos(2*pi*(u*x+v*y));
gfi(m+x+1,n+y+1)=t*sin(2*pi*(u*x+v*y));
end
end
Ir=conv2(I,double(gfr),’same’);
Ii=conv2(I,double(gfi),’same’);
Io=sqrt(Ir.*Ir+Ii.*Ii);
C. Result and Analysis
green colour that the percentage of green colour is decreasing from first image to the third image that is, Image1 have maximum green colour and Image3 have least green colour. Above percentage of green colour can be used in aging the wheat crop. So the Image1 is younger then the Images2 and Images3. And their nutrition requirements can be decided according to their needs for better yield.
HIS components for the 3 images are also calculated and all three images give distinctive values hue (H), saturation(S) and intensity (I). Hue is maximum for the Images1 and it decreases as the crop ages similarly saturation level also decreases with the age of crop. But the intensity is maximum in Image1 and decreased with age of crop.
IV. CONCLUSION
Good yield of a crop species is dependent upon critical growth stages so that the plant can capitalize on favourable weather periods during the growing season. An understanding of how crops respond to environmental stresses at different stages of growth can assist in the assessment of crop condition and production potential throughout the cultivating season. In this paper we have taken three different image of wheat crop during different intervals. Certainly images were taken when the crop’s nutrition demand changes that is, Demand of fertilizer and other nutrients changes with growth of crop. Supply of fertilizers and nutrients on the basis of crop age can lead higher yield. Using Colour processing of Digital image processing the age of wheat crop is found and necessary action can be taken according to age of crop. Judging the maturity of wheat crop can be done.
REFERENCES
- J. Yang and X. Li, “Design and implementation of low-power wireless sensor networks for environmental monitoring”,Proc. of IEEE International Conference on Wireless Communications, Networking and Information Security, Beijing, China, June 2010, pp. 593-597.
- N. Giannopoulos, C. Giannopoulos, A. Kameas “DesignGuidelines for Building a Wireless Sensor Network forEnvironmental Monitoring” Proc. of 2009 Panhellenic Conference on Informatics, Corfu Greek, September 2009, pp. 148-152.
- F. Cuomo S. Della Luna, U. Monaco, U, and T. Melodia“Routing in ZigBee: Benefits from Exploiting the IEEE 802.15.4 Association Tree”, Proc. of IEEE International Conference on Communications, Glasgow, Scotland, June 2007, pp. 3271-3276.
- K. Lu, Y. Qian, D. Rodriguez, W. Rivera, and M. Rodriguez“Wireless Sensor Networks for Environmental Monitoring Applications: A Design Framework”, in Proc. IEEE Global Communications Conference, Washington, DC, November 2007, pp. 1108-1112.
- B. Pekoslawski, et. al. “Autonomous wireless sensor network for greenhouse environmental conditions monitoring”, Proc. of the 20th International Conference on Mixed Design of Integrated Circuits and Systems, Gydnia, Poland, June 2013, pp. 503-507.
- Guillermo Barrenetxea, Franc¸ois Ingelrest, Gunnar Schaefer, and Martin Vetterli. “Wirless Sensor Network for Environmantal Monitoring : The SesnsorScope Experience”,Proc. of 2008 International Zurich Seminar on CommunicationsZurich, Switzerland, March 2009, pp. 98- 101
- I. Akyildiz, W. Su, Y. Sankarasubramaniam, and E. Cayirci,“Wireless sensor networks: A survey,” Computer Networks, vol. 38, pp. 393–422, 2002.
- ZigBee Specification, ZigBee Alliance Std. 2005 [online]. Available at : http://www.zigbee.com
- Mittal Ruchi and Bhatia. M.P.S “Wireless Sensor Networks for Monitoring the Environmental Activities” Computational Intelligence and Computing Research (ICCIC), IEEE International Conference, Coimbatore, India, December 2010, pp.1-5.
- Jelicic. Vana, Razov Tomislav. Oletic, Kur. Marijan, and Bilas Vedran “MasliNET: A Wrielsess Sensor Network based Environmental Monitoring System” MIPRO, Proceedings of the 34th International Convention, Opatija, Croatia, May 2011, pp. 150-155.