Himmat Singh Bhati
M.Tech Scholar, Department of CEIT, Suresh Gyan Vihar University, Jaipur
bhati425@gmail.com
Sohit Agarwal
Associate Professor, Department of CEIT, Suresh Gyan Vihar University, Jaipur
sohit.agarwal@mygyanvihar.com
Abstract: Here in this research paper we are designing an artificially intelligent demand forecasting system. This system is developed for Time Square mall. We have collected the data of time square mall and predict the demand forecast for the ten new time steps. Here we have used ARIMA model which is a robust statistical tool.There are several statistical methods to solve this problem but ARIMA is the most popular tool for time series prediction. The performance criteria is the mean square error.
Keywords: Demand forecast, ARIMA, Statistical model, Test and Training.
I. INTRODUCTION
The actual market force is the demand. When we define demand this is basically a relation between the consumers ability to purchase an item on the varying prices but at the same time keeping other factors constant. Therefore, if we look at other factors also like market situation etcit is a prediction [1, 2]. Demand is basically deals only with the quantity of the product. It doesn’t matter which type of quality it is and the price of the good supposed to be unchanged for a time period and can vary in different time slots.
Therefore, if they look to the definition of, there are two points, no one will be able to buy, and the other to the work of wishing to buy.
Then we will not belong to one of the species is demand, and you will see different types of demand, on the first that comes to individual demand, the market [3], the amount of the benefit of each and every thing indeed is willing, and able to buy it from their own particular a price between what is defined is to be granted is / the time of return, or in sense of taste and the price from the other things, as an alternative to individual demand also referred to as [4]. And complements products available in the market. For this reason, a hotel, or otherwise for any period of time which he has willed the price of the price of the level of demand for the ability of each, for the most part. For that reason, here there are two seasons, to present, if this is a little what has been said, and the other [6], and in the second book of the acts of [7].
If the product is legal, does not support the product with another product consumption are not present, and this is basically ordinary goods. Otherwise, we will give thee two to this day two kinds of good, is a good way, a model is the tea and coffee again the second time, however, complementary goods, and, in this case one is not able to make one things are good by the end of the without the consummation of the other things, by his own example, are always as if food has been, or of the bread, motor or gasoline, or am already made, bread, and butter.
The consumer preference that if his demand of a particular item is depends also on the demand of other item or we can say that the demand of an item affect the demand of another item is called the individual demand. Supply chain management plays a vital role in demand and supply of an item. The supply chain can be represented by the following diagram.
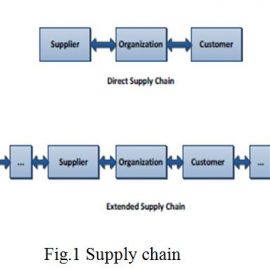
Fig. 1 shows the direct and extended supply chain. In direct supply chain there is relation between supplier and customer where as in the indirect supply chain there is relation between supplier’s supplier to customer’s customer.
II. DATA COLLECTION AND MODEL PREPARATION
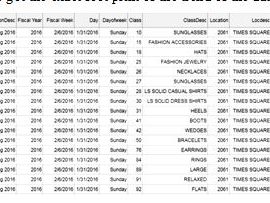
We have collected the data from Time Square mall. Sample size of the data is 89290. Data is collected for the duration of 31/1/2016 to 2/3/2018. There are at most 130 different items. The feathers of the various categorical items are
- Year
- Session
- Day
- Week
- Class of item and
- Sales
Firstly the data was processes and then use the ARIMA model for time series prediction. ARIMA is an auto regressive moving average model.
III. EXPERIMENTAL SETUP
Experimental testing requires dataset
Dataset
Dataset having the following features.
- There are 737 total sample for each class of items
- Training samples: 600
- Testing samples: 135
- ARIMA Model is used for Training
- A performance criterion is MSE.
The data set is showing in Fig.2. The task has done in python programming.
IV. RESULTS AND DISCUSSION
The evaluation metric which was used in measuring the errorrate is MAPE. Equation 1 shows how to calculate MAPE value
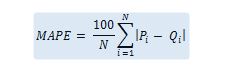
where Pi is actual value and Qiis forecasting value.
The predicted and the actual results are shown in Fig. 2
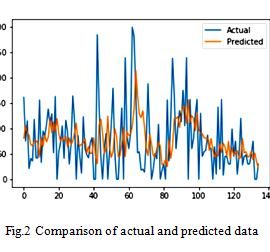
in this research paper we have collected the data of time square mall and predict the sale forecast for the ten new time steps. Here we have used ARIMA model which is a robust statistical tool. We have got the exact foot print of the trend of the data and the value of MSE is 4576. This value is not scaled that’s why it is high.
V. CONCLUSION
Here we are designed an artificially intelligent demand forecasting system. This system is developed for Time Square mall. We have collected the data of time square mall and predict the demand forecast for the ten new time steps. Here we have used ARIMA model which is a robust statistical tool. There are several statistical methods to solve this problem but ARIMA is the most popular tool for time series prediction. The performance criteria is the mean square error.
We have got the exact foot print of the trend of the data and the value of MSE is 4576. This value is not scaled that’s why it is high.
References
[1] Y. W. Chang, and M. Y. Liao, “A seasonal ARIMAmodel of tourism forecasting: The case of Taiwan”, Asia Pacific journal of Tourism research, Vol. 15, No.2, pp. 215-221, 2010.
[2] S. Cang, “A Comparative Analysis of Three Types of Tourism Demand Forecasting Models: Individual, Linear Combination and Nonlinear Combination”, International Journal of Tourism Research, Vol. 16,No. 6, pp. 596-607, 2014.
[3] G. E. Box, and G. M. Jenkins, Time series analysis: forecasting and control, revised ed, Holden-Day, 1976.
[4] J. H. Holland, Adaptation in natural and artificial systems: an introductory analysis with applications to biology, control, and artificial intelligence, U Michigan Press, 1975.
[5] R. S. Sexton, R. E. Dorsey, and J. D. Johnson, “Toward global optimization of neural networks: a comparison of the genetic algorithm and back propagation”, Decision Support Systems, Vol. 22, No. 2, pp. 171-185, 1998.
[6] J. A. Bullinaria, “Using evolution to improve the neural network learning: pitfall and solutions”, Neural Computing & Applications, Vol. 16, pp 209-226, 2007.
[7] Y. H. Liang, “Combining seasonal time series ARIMA method and neural networks with genetic algorithms for predicting the production value of the mechanical industry in Taiwan”, Neural Computing andApplications, Vol. 18, No. 7, pp. 833-841, 2009.
[8] R. Fildes, K. Nikolopoulos, S. F. Crone, and A. A, Syntetos, “Research in forecasting: a quarter-century review, 1960-1984”, Journal of the OperationalResearch Society, Vol. 59, No. 9, pp. 1150-1172, 2008.
[9] J. S. Armstrong, “Forecasting and operational research: a review”, Interfaces, Vol. 16, pp 89-109.