Asmita V. Gaikwad1*, Preeti Khulbe2
- Research Scholar, School of Pharmacy, Suresh Gyan Vihar University, Jaipur, Rajasthan, India.
- School of Pharmacy. Suresh Gyan Vihar University, Jaipur, Rajasthan, India.
*Corresponding Author E-mail: asmitavgaikwad@gmail.com
Abstract:
Type 2 diabetes mellitus raises the risk of cardiovascular disease since it is a chronic metabolic infection (CVD). Glycosuria is a side effect of the most recent anti-diabetic medicine, SGLT2i, which inhibits glucose absorption by the kidney’s proximal tubule. It’s now possible to buy canagliflozin, dapagliflozin and so on the open market in many countries, all of which are SGLT2i medicines. SGLT2i lowers blood glucose levels by 0.5-1 % and has been shown to have significant impacts on weight, heart rate, blood vessel hardness, and endothelial function. An impressive list of cardioprotective and renal protective properties of SGLT2i may be found here. According to research, the primary components that underlie their cardioprotective effects are improvements in cardiovascular cell digestion, improved ventricular stacking conditions, restraint of the Na+/H+ trade-in myocardial cells, modifications to adipokines and to cytokines production as well as decreased heart cell corruption and cardiovascular fibrosis. Both euglycemic diabetic ketoacidosis and urinary tract infections are serious side effects of SGLT2i. The scientific community is also concerned about the connection between SGLT2i and a variety of adverse effects, including lower appendage removals, Fournier gangrene, bone fractures, the development of malignant tumors in women’s breasts, male bladder disease, orthostatic hypotension, and severe kidney damage.
Keywords: SGLT2 Inhibitors, Cardioprotective, Diabetes mellitus, Antidiabetics
INTRODUCTION:
Diabetes mellitus is associated with chronic hyperglycemia, often known as hyperglycemia, which is caused by a lack of insulin synthesis, action, or both (DM). Type 2 diabetes can be diagnosed if a patient meets any or all of the four-plasma glucose (PG) criteria, which include an elevated fasting plasma glucose (FPG) of more than 126 mg/dL, 2-hour plasma glucose (PG) level of more than 200 mg/dL during an OGTT, or a random PG level of more than 200 mg/dL with classic hyperglycemia symptoms. An anti-diabetic medicine may fall into one of many main categories, ranging from biguanides (biguanide-like pharmaceuticals) through meglitinides to the more common TZD class of drugs [1–10]. Methods for detecting anti-diabetic drugs of the SGLT2 class in bulk and various pharmacological dosage forms were examined. This research also focuses on the approach developed for the evaluation of medications alone or in combination formulations with other oral hypoglycemics.
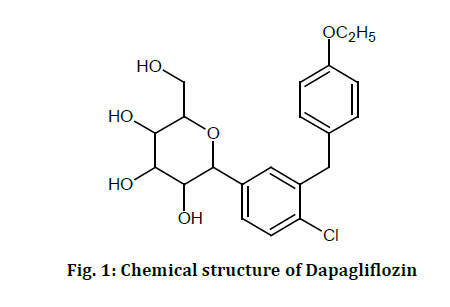
DAPAGLIFLOZIN
Dapagliflozin is a medication of the gliflozin class (DAPA). It is a tetrahydro-2Hpyran-3,4,5-triol with a molecular weight of 408.875g/mol and the chemical formula C21H25ClO6 (fig. 1). It is a white crystalline solid because of its solubility in organic solvents such as DMSO dimethyl formamide and ethanol. Its melting point is between 55°C and 60°C [11-12]. As an antihyperglycemic drug that inhibits the enzyme (SGLT2), Dapagliflozin has been shown to inhibit SGLT2. Dapagliflozin, a glucose gut co-transporter inhibitor, inhibits SGLT2 selectively and potently. Reduced glucose excretion through urine occurs as a consequence of dapagliflozin’s action of blocking glucose entry into the kidneys [13-15].
High-Performance Liquid Chromatography:
Developed from classic column chromatography, High-Performance Liquid Chromatography (HPLC) is an analytical chemical method. High-pressure liquid (mobile phase) and a solution of the sample are driven through the column at a rapid pace. Due to the different partitioning of samples into stationary and mobile phases, column migration rates vary. Heterogeneous high-performance liquid chromatography (HPLC) is more versatile than gas chromatography, which can only analyze volatile or thermally stable compounds. High-performance liquid chromatography (HPLC) is required for the analysis of pharmaceuticals (HPLC). A method’s performance characteristics and limitations are critical to evaluating how much it is impacted by external circumstances. Many analytical methods may be used to evaluate the anti-diabetic drug Dapagliflozine (SGLT2 inhibitor) [16-21].
Method Validation:
When validating a method, keep in mind the ICH principles for analytical technique validation1, 2. A thorough review of any methodological approach beyond the scope of the ICH recommendations is a must [21,22].
Ultra-high performance liquid chromatography:
The chemical analysis uses ultra-high performance liquid chromatography as an important tool (UHPLC). It uses column chromatography, a common method for analyzing complex mixtures. It is, in fact. The polarity of analytes and the interactions between analytes, stationary phase, and mobile phase are the basis for this separation and identification procedure.
Ultraviolet-visible spectroscopy
Absorption and reflectance spectrophotometry in the ultraviolet and visible ranges is known as UV–Visible spectrum analysis. In terms of wavelengths, it is a light source that can be seen. The color of a chemical is directly related to its ability to absorb or reflect light in the visible range. In this region of the spectrum, atoms and molecules go through electronic transitions. To complement electron transitions from the ground to the excited state, absorption spectroscopy examines them instead of electrons transitioning from the excited state to the ground state as is the case with fluorescence spectroscopy.
High-performance thin-layer chromatography(HPTLC)
Improved thin-layer chromatography (HTLC) employs high-performance thin-layer chromatography (HPLC) (TLC). For example, automation of operations, increased resolution, and more exact quantitative measurements may all be achieved via improvements in thin-layer chromatography. It may be possible to lessen the variability in droplet size and position by automating the TLC plate application procedure. One way to automate the procedure is to use piezoelectric devices and inkjet printers to apply the sample. Two solvents may be employed to increase spot capacity in two-dimensional chromatography. First solvent development of the sample-loaded plate is all that’s required to finish the process. After the first solvent is removed, it is rotated 90 degrees and developed with a second solvent.
Capillary electrophoresis (CE):
A submillimetre-sized capillary electrokinetic separation method known as capillary electrophoresis (CE) is used in CE. Several electrophoretic techniques, including as capillary electrophoresis (CZE), capillary gel electrophoresis (CGE), capillary isotactic-phoresis, and micellar electrokinetic chromatography (MEKC), are included in the CE family of procedures (MEKC). In CE methods, analytes are pushed through electrolyte solutions by an electrical field. Detection of analytes may be done via ionic mobility and non-covalent interactions. Concentrating analytes may also be achieved by using gradients in conductivity or pH.
A literature survey regarding HPLC method of development of DAPAGLIFLOZIN [23-30].
investigations conducted by T. Deepan and other researchers (2017) Simple, accurate, and stability-indicating HPLC techniques can assess MET and DAP in pharmaceutical dose forms at the same time. The materials were separated on an Inspire 5 microcolumn by means of an isocratic flow (4.6 x 150mm, 5m). Acetonitrile (70:30, v/v) and orthophosphoric acid buffer were added to the mobile phase as the flow rate rose (0.1M). The UV detection was carried out at a wavelength of 260nm. A retention period of 2.097 minutes and 3.691 minutes were recorded for MET and DAP, respectively, in the trials. Linearity, precision, accuracy, specificity and ruggedness are all considered in the International Conference on Harmonization’s regulations. DAP doses of 5-25 g μg/ mL and MET concentrations of 500-2500 μg/ mL showed a linear response. The detection limit for DAP was 2.98 g/mL, whereas the limit for MET was 3.05 g μg/mL and 10.07 μg/mL, respectively. Both MET and DAP were put through their paces under various stressors such as oxidative as well as thermal stress. Stressed samples have to undergo the new method’s inspection as a result. To discriminate between analytes and degradation products, this method is ideal. Drug tablets containing Metformin and Dapagliflozin have been found to be reliably approximated by the method. This helps with quality control and stability research.
RP-HPLC was devised and verified in compliance with ICH requirements for Dapagliflozin’s tablet dosage form by Mante, and others (2018). The isocratic technique of chromatographic separation employed Princeton C18 column, flow rate of 1 mL/min, and 224nm detection wavelength for acetonitrile: Triethylamine (pH-5.0) in the ratio of 50:50 v/v as the mobile phase. Under ideal chromatographic conditions, the drug’s retention time was reported to be 5.163 minutes. The proposed method followed Beer’s-law Lambert’s with a correlation coefficient of 0.999 in the range of 10–70 μg/mL. The average percent amount of medicine determined was 100.57 % in accordance with the label claim of the commercially available tablet formulation. For example, the method’s validation characteristics, such as accuracy and precision as well as robustness, linearity of the linearity, and range were extensively assessed. pH (acid/basic), oxidative stress, temperature, and light/humidity fluctuations were among the other stress tests.
Gunasekar and others (2018) Analytical methods for the RP-HPLC analysis of raw and tablet forms of Dapagliflozin were developed and validated. Reverse-phase C columns with methanol/water (75:25v/v) mixtures were used to separate pharmaceuticals with great success. The absorption peaks at 230 nm were measured using an SPD-20A Prominence UV-Vis detector with a flow rate of 1 mL/min. The linearity of dapagliflozin was excellent between 5 and 25μ g/mL. Pureness of tablet formulations is 99.98 % to 100.12 %, depending on the HPLC technique employed in HPLC testing for this drug. Dapagliflozin has a purity level of 100.22 %. The chromatographic retention time of Dapagliflozin is 3.1 minutes. The tailing factor was 0.970. In accordance with the ICH guidelines, the novel approach was tested and proven to be safe and effective. This method was used to create and verify the tablet formulation of Dapagliflozin.
Ganorkar and his colleagues (2020) came up with the idea DPG, a sodium-glucose co-transporter 2 (SGL–2) inhibitor, has been developed as a strong treatment for type 2 diabetes (T2DM). The drug is crucial for both therapy and research in view of the severity of the ailment. Pharmaceutical dose form DPG has significant potential whether taken alone or in combination with other anti-diabetic drugs. Saxagliptin (SAX) and Metformin (MET) are often used in combination with DPG (SXG). Dapagliflozin’s pharmacological, analytical, and bioanalytical features have been further elucidated by its interaction with other medicines. This is why the authors have included all of the required pharmacological and physical chemistry information to make these calculations possible. The authors provide a crucial new perspective on the recently discovered Gliflozins and DPG. In addition to comparing pharmacological estimate studies in the literature, this page also compares analytical investigations in the field. As of this writing, 53 studies have been published, according to the exhaustive literature searches. There is a comprehensive review of the most frequent, hyphenated, and unique ways to analyze. In order to determine if there is a pattern in the employment of analytical procedures, data has been collected from their original publication in 2010. To improve analytical research and the therapeutic future of DPG, this study studies the pharmaceutical estimate of DPG. DPG is a novel SGL-2 Inhibitor antidiabetic.
Ramya kuber and others (2021) The novel UPLC technique may be used to reliably assess the concentrations of Sitagliptin and Ertugliflozin in bulk and pharmaceutical forms. ICH Q2R1 guidelines were adhered to in the validation of this method. The new approach differed significantly from the old one in terms of validation parameters and stability-indicating investigations. Validation results like LOD, LOQ, and precision demonstrated that the instrument is capable of delivering accurate results even at the lowest concentrations. According to degradation experiments, the retention period of Sitagliptin and Ertugliflozin peaks was unaffected by degradation peaks of Sitagliptin and Ertugliflozin. This method can be used for the quality control analysis of SIT and ERT in both bulk and pharmaceutical formulations, according to the results of this study.
HPTLC
For the detection of anti-diabetic medication combinations in pharmaceutical formulations, simple, fast, and reliable LC and HPTLC processes were used in research by Sally Nasser and colleagues (2018). Measurement of MET and DAP in a real sample has never been done before using HPTLC. The developed chromatographic procedures have a good combination of accuracy, specificity, linearity, precision, and robustness. Only a few of the advantages of the new technologies over the old include a fast chromatographic run time, simple mobile phase and sample preparation, and appropriate chromatographic settings. The methods are now routinely employed in quality-control laboratories. We think that the recommended procedures can be employed to extract the two drugs from biological fluids because of their great sensitivity and dependability.
- V. SUMA and colleagues (2019) from biological fluids because of their great sensitivity and dependability. As evidenced by the results of the experiments and the data gathered, this method is simple and accurate. It is possible to use the method established and proven to determine DAPA levels in both bulk medicine and tablet dosage forms. The findings were unaffected by the excipients included in the formulation. Using a little amount of mobile phase for several samples simultaneously saves both time and money. The method does not need expensive chemicals and solvents as an alternative to HPLC techniques.
Afnan E. and others (2020) There has been an increase in the incidence of type 2 diabetes. The two drugs are typically used together in the treatment of type 2 diabetes, with the addition of either Saxagliptin Hydrochloride (SAX), or Dapagliflozin (DAP). As a result, no single HPTLC method has been disclosed for measuring MET, SAX, and DAP in their tablets at the same time under the same experimental conditions, which is critical for quality control. Because it can concurrently analyze a large number of samples in a shorter amount of time, using less solvent, and at a cheaper cost, the HPTLC technology provides advantages over HPLC. The fundamental purpose of the proposed technique is to use HPTLC densitometry to simultaneously evaluate MET, SAX, and DAP. Aluminum HPTLC sheets coated with silica gel 60 F254 were used to separate acetonitrile:1% w/v ammonium acetate: 9:1 (v/v) as the mobile phase. Scanners worked with a 210 nm wavelength. There is linearity between 0.25 and 10 g/band for SAX and 0.25 and 25 μg/band for DAP and MET techniques, respectively. The technique was extensively validated in accordance with ICH standards. The method’s accuracy and precision were considered good with an error and deviation rate of less than 2%. Methods to analyze MET/SAX, MET/DAP, and SAX/DAP pharmaceutical tablets were successful.
UHPLC
Michael W. & Co. (2014) A growing number of quality control labs are turning to ultra-high-performance liquid chromatography (UHPLC). HPLC applications and method development are becoming more dependent on novel column types, equipment, and software. These two words are becoming more interchangeable as technology gets more commonly employed. An in-depth look at the development of new methods using ultra-high-performance liquid chromatography (UHPLC). Method creation and analysis of complex materials may be done more quickly and accurately because to UHPLC’s high throughput and high-resolution capabilities. The most recent improvements in HPLC and UHPLC method conversions, column screening, and automated optimization were reviewed. There are continuing issues with the cost of UHPLC and the interoperability of different UHPLC systems The transition from HPLC to UHPLC is still possible, however, this is expected to be lessened over time as older HPLC equipment is phased out.
The work of S. Madhavi and his colleagues (2017) UPLC (Ultra Performance Liquid Chromatography) was used to develop and verify a method for the simultaneous determination of Saxagliptin and Dapagliflozin in the tablet dosage form. C18 reverse-phase 2.1 mm, reverse phase C18 column with mobile phases containing 0.1 percent orthophosphoric acid (40:60) as mobile phase was used in the UPLC approach. The injection volume was set to 1 μL, the flow rate was 0.3 ml/min, and the run time was set at three minutes using PDA detection at (λmax) 254 nm. Validation variables were used to assess the method’s accuracy, precision, linearity, and robustness. A quality control tool for tablet dosage forms of pharmaceutical medications might be developed using this data.
Manasa. S. and others (2014) New, easy and safe UV-spectrophotometer method was used to analyze the Type II anti-diabetic drug Dapagliflozin. Following ICH guidelines, the novel technique was tested. The drug’s greatest absorption was seen between 203nm and 237nm. This method may be used to reliably estimate Dapagliflozin in bulk for routine testing reasons using UV detection at 237nm. Labindia spectrophotometers with 1cm matched quartz cells were used for this technique, and ethanol was used as the solvent. Beer’s-law Using the suggested method, Lambert’s was found in the range of 0.5-0.9 μg/ml, with a correlation value of 0.994. The system’s precision, detection limit, and quantitation limit have all been assessed and found to be acceptable.
BR Jani and others (2015) First derivative spectroscopy was used to synthesize DAPA and Metformin hydrochloride in a new, simple, sensitive, fast, accurate, and inexpensive way (MET). The first-derivative technique is used to resolve this issue since it relies on measurements of absorbance at two different wavelengths. UV visible spectrophotometers with quartz cells and methanol solvents were utilized in this method. 235 and 272 nm wavelengths were employed in this method. In the concentration range of 0.5-2.5 μg/ml, the proposed approach followed Beer’s-law, Lambert’s with a correlation coefficient of 0.984 for Dapagliflozin and 25-125 μg/ml, with a correlation value of 0.982 for Metformin hydrochloride. The derivative spectrum is better at resolving overlapping bands than the basic spectrum. It was discovered that many validation parameters, such as precision, limit of detection, and limit of quantitation, were within acceptable levels. Results showed that the techniques were statistically sound. This approach was shown to be a suitable choice for estimating the concentration of Dapagliflozin and Metformin hydrochloride in a synthetic combination after the results of the validation were reviewed.
Mantee and others (2017) UV-spectrophotometric approaches for Dapagliflozin estimation were developed and tested in compliance with ICH guidelines. With a UV-visible spectrophotometer, a 1 cm matched quartz cell, methanol or water, and calibration curves, AUCs, and first- and second-order derivative techniques based on absorbance measurements, it is feasible to quantify absorbance at specified wavelengths. All proposed techniques followed Beer’s-Law Lambert’s with a correlation coefficient smaller than 1 in the concentration range of 5-40 μg/mL. According to the label claim on the commercially available tablet formulation, these techniques were able to estimate roughly 100% of the drug content. The results of the five phases of the recovery study were found to be satisfactory. In terms of precision, ruggedness, linearity, and range, all of the developed approaches were found to be within acceptable limits. Regular quality control may be utilized to estimate the quantity of medicine in a formulation using the recommended technique.
Bhadauria and others (2019) This method was developed and verified in accordance with ICH standards for the estimate of dapagliflozin (DAPA), saxagliptin (SAXA). An equation may be solved simultaneously based on the absorbance at two different wavelengths (222nm and 276nm). This approach employs a phosphate buffer with a pH of 6.8. There are two drugs that follow Beer’s rule between 5 and 25 micrograms per milliliter. For both drugs, the recovery rate was between 98 and 99 %, indicating high accuracy. There was a relative standard deviation smaller than 2%, showing that the processes utilized were accurate. Procedures developed in accordance with ICH guidelines were examined and found to meet the necessary accuracy and other statistical analysis values. A wide range of pharmaceutical applications, such as assaying bulk drugs and commercial formulations, may benefit from its utilization (QTERN tablets, Astra Zeneca).
Capillary electrophoresis
A capillary electrophoretic technique linked to a diode array detector was developed and validated by Hadir M. Maher and colleagues (2019) for the simultaneous detection of metformin hydrochloride (MET), the DPP-4 inhibitor saxagliptin hydrochloride (SAX), and the sodium-glucose co-transporter 2 inhibitor dapagliflozin (DAP). The combination of SAX and MET, DAP/MET, and SAX/DAP were investigated in their binary antidiabetic combinations. The electrolyte utilized for the CE separation was 30mM phosphate buffer (pH 6.8), and the voltage, pressure, and injection time were all set at 30kV, 20mbar, and 40s, respectively. In the range of 203nm and 250nm, SAX/DAP and MET were found. By using this strategy, linearity was shown to exist in the concentration ranges of DAP, 10–200 mg/mL (SAX), and 7.5–1000 mg/mL (Sax) (MET). In compliance with ICH guidelines, the proposed method was rigorously evaluated. The findings show that the error and deviation percentages achieved did not exceed 2 percent. The recommended method’s ability to detect stability was put to the test under a variety of stressful conditions. The proposed technique was effective in analyzing the three binary combinations on their tablets.
HPLC analysis of Canagliflozin:
The C-glycosyl compound canagliflozin, which is used to treat type II diabetes, inhibits glucose transport protein subtype 2. Fluorine thiophene and C-glycosyl members of the compound C-glycosyl
The authors Kaur et al., (2016) attempted to develop a simple, authentic, and stability-indicating HPLC method for the assessment of Canagliflozin in bulk and tablet dosages. One milliliter per minute, a 20-microliter injection volume, and 55:45 acetonitrile: orthophosphoric acid (v/v) were the optimal parameters for this experiment. Linearity, Precision, Accuracy; Robustness and Ruggedness; Robustness and Ruggedness; the Limit of Detection (LOD) and LOQ were used to assess the technique (LOQ). Temperatures of 30oC and 290nm photodetector array detectors were employed to monitor eluents as they were separated. Area and concentration must fall within a range of 1 to 6 μg/ml to provide a linear calibration curve. The retention duration was 6.29 minutes in this example. Canagliflozin was recovered from tablet formulations with a recovery rate of 99.6 to 99.8 percent. There were 99.92 percent results in the percentage test for INVOKANA® canagliflozin tablets. Based on these findings, researchers have devised a novel method for conducting frequent assessments of Canagliflozin in bulk and prescription dosage form. For LOD and LOQ, precision and accuracy were within acceptable levels. Canagliflozin is unstable in alkaline, acidic, and oxidative conditions, as well as high temperatures and intense light. Canagliflozin has been certified for routine use in quality control laboratories after statistical analysis indicated no influence from degradation products. 20 Precipitation occlusion of the column might occur if the mobile phase has a high concentration of ortho-phosphoric acid.
Marella and her colleagues (2017) set out to develop a simple reverse phase HPLC method for the identification of Canagliflozin in bulk and prescription quantities. After their efforts, they determined that the Canagliflozin peak eluted at 4.4 minutes. At 1.2 ml/min of 0.02 percent Formic acid: Acetonitrile (40:60), the calibration standard was utilized to monitor the eluents and obtain a linear calibration. Under certain conditions, an ODS-3 column might also be used. The average percentage assay was found to be 98.2. In compliance with ICH recommendations, canagliflozin in bulk and pharmaceutical dosage form were determined using LC-MS compatible mobile phase composition in a short run time to test the procedure.
There are two methods for measuring canagliflozin in bulk and tablet dose form that has been developed and validated by Singh et al. (2019). Spectroscopy and high-performance liquid chromatography were performed using optimized instrument settings. The low-pressure gradient mode yielded a strong peak with a short retention time of 4.732 minutes when acetonitrile and orthophosphoric acid (0.01 M) was used as the mobile phases. Using methanol as a solvent, the spectrophotometric determination of molar absorptivity at 280 nm was satisfactory. Both spectrophotometric and high-performance liquid chromatography methods were found to have RSD values of less than 2% and recovery values that were within the standard limits (90-110 percent). A p-value of 0.05 was determined to be statistically insignificant when compared to the other approaches. For the bulk and tablet forms of canagliflozin, we found the procedures effective and feel they might be utilized on a regular basis.
In a study published in 2018, Parida et al. used Reverse Phase High-Performance Liquid Chromatography to measure canagliflozin. C18 column and UV detector (VWD detector) at 293 nm were utilized in the experiment. The phosphate buffer solution was used at a rate of one milliliter per minute. There was a noticeable change in the retention time of the Chromatogram after this procedure. Recovery after canagliflozin was found to be between 99.33 and 99.92 %, according to the results. In addition, the method was tested in compliance with ICH guidelines. A Canagliflozin linearity test was done with a correlation value of 0.999 in the 10-125 μg/ml range. According to the norms, the medication was recovered at a rate of 98-102 %.
HPLC Analysis of Empagliflozin:
Empagliflozin is a beta-glucosyl residue with a benzyl phenyl group in the anomeric core of one of the most often prescribed C-glycosidic drugs. The C-glycosyl molecule also has characteristics such as monochlorobenzenes, aromatic ethers, and tetrahydrofuran ethers. Because of this, empagliflozin helps to improve kidneys’ capacity to eliminate glucose from the blood. Type 2 diabetics may benefit from the usage of empagliflozin by combining it with a nutritious diet and regular exercise to better control their blood sugar levels.
In a study by Siridevi et al. (2019), the HPLC method was utilized to quantify the quantity of Empagliflozin in bulk and tablet dosage form. Chromatography was performed using an Enable C18G column. Mobile phase was methanol and water in a 70:30 % v/v ratio, and effluent was detected at 233nm at a flow rate of 1 ml/min. The half-life of the chemical was 6.2 minutes. Successfully applied to empagliflozin tablets, the percentage of empagliflozin recovery from tablet formulation was found to be between 99.55% and 99.999% An ICH-approved method for routine quality control analysis of empagliflozin purified and tablet dosage forms has been shown to be simple, accurate, precise, and repeatable. Results from statistical analysis and low percentage RSD values suggest that the method is precise, accurate, robust, specific, and can be used across a wide range of concentrations. Because of these important factors, this technique was deemed better than others.
HPLC was utilized by Godasu and Sreenivas (2017) to examine Metformin and Empagliflozin in combination for the first time. Accomplished in building and using Chromatographic symmetries of C18, 5μl; 1ml/min flow rate; and 70%:30% mobile phase ratio Waters HPLC Auto Sampler was used to detect Methanol in the phosphate buffer after pH adjustment with orthophosphoric acid. It took Metformin and Empagliflozin 2.403 minutes and 3.907 minutes to have an effect on the body. They found that the purity of both Metformin and Empagliflozin was 99.87 % and 100.27 %. Analytical procedures were evaluated and determined to be accurate in accordance with ICH guidelines. A 99.56 percent and 99.48 % data recovery rate were found to be the most accurate. LOD and LOQ values ranged from 2.17 to 0.0372 and 6.60 to 0.1125, respectively. This method, which is simple, precise, accurate, and sensitive, may be used to assess the concentrations of Metformin and Empagliflozin in pharmaceutical dosage forms.
Reverse-phase HPLC (RP-HPLC) was developed and verified by Shyamala and colleagues (2016) for the analysis of the API of Empagliflozin. OPA as a percentage of GDP: For detection, acetonitrile was utilized in a 70:30 acetonitrile: acetonitrile ratio with a flow rate of 1 ml/min and temperature of 30°C. Following ICH guidelines, the novel technique was tested and passed all of its tests. For this study, researchers looked at how the medication decomposed under acidic and alkaline conditions as well as those with peroxides and UV radiation. For the evaluation of Empagliflozin API, RP-HPLC was created and proved to be simple, selective and sensitive, and accurate stability indicators. As a bonus, researchers observed that the approach was straightforward, accurate, and steady throughout the whole testing process. Degradation studies have confirmed the drug’s long-term stability. The disclosed method is safe and effective for routine analysis of Empagliflozin API.
Conclusion
SGLT2 Inhibitors, such as Dapaglifozin, are available to treat diabetes, as shown by a comprehensive review of the research. The management of diabetes mellitus may become easier with the use of active SGLT2 Inhibitors. However, much research has been done, SGLT2i’s cardiovascular-renal insurance systems remain mysterious. According to a survey of the literature, numerous theoretical systems have yet to be verified by preclinical models or modest human investigations. SGLT2i’s cardio/nephroprotective benefits in diabetics may be due to a variety of factors, none of which has a monopolistic hold or a single, unifying explanation. Medications in this class have been shown to minimize the risk of cardiovascular events, hyperglycemia (HHF), and the development of diabetes-related kidney infections. This strong data should be carefully considered by clinicians treating T2D patients, particularly those with cardiovascular or renal risk factors or existing CVD or renal illness.
REFERENCES:
- MB D. Diagnosis and classification of diabetes mellitus. Diabetes Care. 2010;33(SUPPL. 1). doi:10.2337/dc10-S062
- Baynest HW, Baynes HW. Classification, Pathophysiology, Diagnosis and Management of Diabetes Mellitus. Baynes J Diabetes Metab. 2015; 6(5):541. doi:10.4172/2155-6156.1000541
- Chaudhury A, Duvoor C, Reddy Dendi VS, et al. Clinical Review of Antidiabetic Drugs: Implications for Type 2 Diabetes Mellitus Management. Front Endocrinol (Lausanne). 2017;8. doi:10.3389/fendo.2017.00006
- Chaudhury A, Duvoor C, Reddy Dendi VS, et al. Clinical Review of Antidiabetic Drugs: Implications for Type 2 Diabetes Mellitus Management. Front Endocrinol (Lausanne). 2017;8. doi:10.3389/fendo.2017.00006
- Siridevi MP, Kumar HT, Rao SY, Rao VPK. RP-HPLC Method for Quantification of Empagliflozin in Pharmaceutical Formulation. Asian J Pharm Technol. 2019;9(3):208-211. doi:10.5958/2231-5713.2019.00035.7
- Sreenivas SKG and SA. A new validated RP-HPLC method for the determination of Metformin HCl and Empagliflozin in its bulk and pharmaceutical dosage forms. International Journal of Pharmaceutical Sciences and Research. doi:10.13040/IJPSR.0975-8232.8(5).2223-32
- Shyamala, Nirmala K, Mounika J, Nandini B. Validated stability-indicating RP-HPLC method for determination of Empagliflozin. Der Pharm Lett. 2016;8(2):457-464.
- Babu DC, Chetty CM, Mastanamma SK. Novel stress indicating RP-HPLC method development and validation for the simultaneous estimation of ertugliflozin and sitagliptin in bulk and its formulation. Orient J Chem. 2018;34(5):2554-2561. doi:10.13005/ojc/340543
- Rao P V, Rao A L, Svum P. Development and Validation of new stability indicating reversed-Phase High Performance Liquid Chromatography method for simultaneous determination of Metformin hydrochloride and Ertugliflozin in bulk and pharmaceutical dosage form. Asian J Pharm Clin Res. 2019;12(1):235. doi:10.22159/ajpcr. 2019.v12i1.28938
- Laxmi, S. Marakatham, R. V. Valli Kumari MSK. RP–HPLC Method Development and Validation for Simultaneous Estimation of Ertugliflozin and Sitagliptin in Bulk and Tablet Dosage Forms. Indian J Appl Res. 2019;9(10):9-13. https://www.worldwidejournals.com/indian-journal-of-applied-research-(IJAR)/fileview/rpandndash-hplc-method-development-and-validation-for-simultaneous-estimation-of-ertugliflozin-and-sitagliptin-in-bulk-and-tablet-dosage-forms_October_2019_1571896195_200. Accessed December 11, 2019.
- Han DG, Yun H, Yoon IS. A novel high-performance liquid chromatographic method combined with fluorescence detection for determination of ertugliflozin in rat plasma: Assessment of pharmacokinetic drug interaction potential of ertugliflozin with mefenamic acid and ketoconazole. J Chromatogram B Anal Technol Biomed Life Sci. 2019;1122-1123:49-57. doi:10.1016/ j. jchromb.2019.05.023
- Anjali M, Manaaz, Shreshta M, Prasanna R, Shrisha T, Kumar MS. Method Development and Validation of Ertugliflozin and Sitagliptin by Using Simultaneous Equation Method. J Innov Pharm Sci. 2019;3(1):22-28.
- Evans JL, Balkan B, Chuang E, Rushkoff RJ. Oral and Injectable (Non-insulin) Pharmacological Agents for Type 2 Diabetes. Endo text. 2000;120(2):1-7. doi:10.3109/03009734.2015.1037032
- Alhadramy MS. Diabetes and oral therapies: A review of oral therapies for diabetes mellitus. J Taibah Univ Med Sci. 2016;11(4):317-329. doi: 10.1016/j.jtumed.2016.02.001
- Sabir AM, Moloy M, Bhasin PS. Hplc Method Development and Validation: A Review. Int Res J Pharm. 2016;4(4):39-46. doi:10.7897/2230-8407.04407
- Gupta V, Jain ADK, Gill NS, Gupta K. Development and validation of HPLC method – a review. Int Res J Pharm Appl Sci. 2012;2(4):17-25.
- Nikolin B, Imamović B, Medanhodzić-Vuk S, Sober M. High performance liquid chromatography in pharmaceutical analyses. Bosn J Basic Med Sci. 2004; 4(2):5-9. doi:10.17305/ bjbms.2004.3405
- Coskun O. Separation Techniques: Chromatography. North Clin Istanbul. 2016. doi:10.14744/nci.2016.32757
- Rutuja R Shah, Rutuja S Shah, Rajashri B Pawar PPG. International Journal of Institutional. 2015;5(June):411-428.
- Shah U, Patel S, Raval M. Stability Indicating Reverse Phase HPLC Method for Estimation of Rifampicin and Piperine in Pharmaceutical Dosage Form. Curr Drug Discov Technol. 2017;15(1):54-64. doi:10.2174/1570163814666170619092224
- Siddiqui MR, AlOthman ZA, Rahman N. Analytical techniques in pharmaceutical analysis: A review. Arab J Chem. 2017;10: S1409-S1421. doi: 10.1016/j.arabjc.2013.04.016
- Peris-Vicente J, Esteve-Romero J, Carda-Broch S. Validation of Analytical Methods Based on Chromatographic Techniques: An Overview. In: Analytical Separation Science. Weinheim, Germany: Wiley-VCH Verlag GmbH and Co. KGaA; 2015:1757-1808. doi:10.1002/9783527678129.assep064
- Jitendra Debata, Sundeep Kumar SKJ and AK. A New RP-HPLC Method Development and Validation of Dapagliflozin in Bulk and Tablet Dosage Form. Int J Drug Dev Res. 2017; 9(2):48-51.
- Shakir Basha S, Sravanthi P. Development and validation of dapagliflozin by reversed-phase high-performance liquid chromatography method and it’s forced degradation studies. Asian J Pharm Clin Res. 2017;10(11):101-105. doi:10.22159/ ajpcr. 2017.v10i11.19705.
- Verma M V., Patel CJ, Patel MM. Development and stability indicating HPLC method for dapagliflozin in API and pharmaceutical dosage form. Int J Appl Pharm. 2017; 9(5):33-41. doi:10.22159/ijap.2017v9i5.19185.
- Mante G V, Hemke AT, Umekar MJ. RP-HPLC Method for Estimation of Dapagliflozin from its Tablet. Int J Chemtech Res. 2018;11(01):242-248.
- Aswini ME and PSB. A review on analytical methods for estimation of dapaligflozin and saxagliptin in bulk and in pharmaceutical dosage forms. Int J Res Pharm Chem. 2018;9(12):5161-5167. doi:10.13040/IJPSR.0975-8232.9(12).5161-67.
- Kaur I, Wakode S, Pal Singh H, Manachanda S. Development and Validation of a Stability-Indicating Reverse Phase HPLC-PDA Method for Determination of Canagliflozin in Bulk and Pharmaceutical Dosage Form. Pharm Methods. 2016;7(1):54-62. doi:10.5530/phm.2016.7.9.
- Marella VL, Syed A, Lakshmi Prasanna, Nalluri BN. A novel validated RP-HPLC method for the estimation of canagliflozin in bulk and pharmaceutical dosage forms. Int J Adv Pharm Anal. 2017;7(3):24-27.
- Singh D, Bedi N, Tiwary AK. Comparison of UV spectrophotometric and HPLC method for estimating canagliflozin in bulk and a tablet dosage form. Indian J Pharm Sci. 2019;81(1):39-44. doi:10.4172/pharmaceutical-sciences.1000477.