Vol. 7 Issue 1 Page No. 1-10
Himmat Kanwar1, Umesh Saxena2, and Mohammad Irfan Ali1*
1School of Applied Sciences, Suresh Gyan Vihar University, Jaipur, India
2Chitransh Group of School, Jaipur, Rajasthan
Abstract
Water is considered as the second obligatory requirement for living organisms from everlasting times. either water is used for groundwater or drinking purposes water quality holds a huge significance. Quality of Ground Water plays a significant role in quality conservation and groundwater protection; therefore, it is a must to review the groundwater quality not only for its present use but also as a latent source of water for future consumption. The present study area, Amer Tehsil in Jaipur is also one of the rapidly growing areas in the state of Rajasthan. In the present study, an attempt has been made by the researcher to recognize the quality of groundwater of the selected sites in and around Amer, Jaipur in Pre- and Post-monsoon phase of the year 2017. The physicochemical parameters like pH, Total Hardness, Electrical conductivity, Chloride, Total Alkalinity, Sulphate, Fluoride, Phosphate, and Nitrate were studied to analyze the drinkable groundwater quality of the area. It was found from the study that water quality is Better in Pre-monsoon season as compare with Post- monsoon season. The level of pollution that occurred may be due to the over-exploitation of groundwater, anthropogenic activities, and urbanization.
Keywords
Amer Tehsil
Ground Water
Hardness
Water Resources
Water Quality
*Corresponding author’s e-mail addresses: irfanclinical.res@gmail.com
Received: 21 July 2020; Accepted: 27 Oct 2020; Published: 25 Jan 2021
Introduction
The quality of Water is basic for prosperity, as it influences the wellbeing and financial status of the nation. Groundwater is the significant wellspring of water for drinking, agrarian, and modern wants. Groundwater is an exceptionally significant wellspring of water due to its one-of-a-kind properties which may not be beguiled by surface water. The greater part of the water is being used by man for local and mechanical purposes. Water can be acquired from different sources among which are the streams, lakes, waterways, lakes, downpour, spring, and wells. Ground Water is the piece of water that arrives at the earth’s surface and permeate into the earth. During the permeation, it comes into contact with various minerals present in the dirt, which might be broken up in the water. It streams down till it arrives at hard rock and may retread an upward way and turns out through spring water. In this investigation, centralizations of synthetic boundaries, for example, pH, DO, BOD, COD, alkalinity, chloride, o-phosphate, nitrate, TDS, conductivity, TH, fluoride, smelling salts, and iron in groundwater tests was dictated by utilizing standard explanatory strategies. Rajasthan state is viewed as a dry and semi-parched area. Because of the shortage of surface water, the individuals in Rajasthan need to rely on groundwater assets. It has outrageous climatic and topographical conditions and people groups face both the issues of amount and nature of water (Bhalla and Bhalla 2003, Yadav et al., 2010). In this state, water contains many broke up substances. These substances have either harmful impacts or have long terms of roundabout consequences for the people groups (Darbi et al., 2003, Dhindsa 2004, Saxena et al., 2018).
Numerous elements of the water quality influence our wellbeing gravely like metal particles, chloride, sulfate, nitrate, and fluoride (Hussain et al., 2004, Sameer et al., 2011, Saxena and Saxena 2013). The 33 districts of Rajasthan have been affected area by fluorosis. Out of them Nagaur, Jaipur, Sikar, Barmer, Ajmer, Sirohi, Jhunjhunu, Churu, Bikaner, are in the very worst condition. etc. (Singh et al., 2011, Arif et al., 2012). Some tehsils of Jaipur district Amer, Chomu, Jamwa Ramgarh, Kotputali and Virat Nagar, etc., fluoride problem is very high (Saxena and Saxena 2015).
In numerous regions, groundwater is the main accessible hotspot for drinking water. In this unique situation, the quick increment in the human populace combined with growing urbanization and industrialization has prompted a more noteworthy unevenness between water accessibility and water request. According to Prasanna et al For the management of groundwater, a quantitative study is not enough. A qualitative study of groundwater is the research is equally important for groundwater management (Saxena and Saxena 2015, Singh et al., 2011).
Jaipur City (Longitude: 95°24′ E; scope: 27°18′ N), the capital city of Rajasthan (INDIA) is one of the quickest developing urban communities in the nation, is experiencing fast urbanization and industrialization. Urbanization has prompted enormous weight on groundwater assets that have brought about the quality decrease of groundwater too. There are many places in the Amber block of the Jaipur district of Rajasthan. The sub-locale code of Amber square is 302028 according to Census 2011 data.
In a variety of places of subjective interest, various researchers have tried to report the quality parameters of ground, industrial & river. But regrettably in pre- and post-monsoon in Amer Tehsil, no qualitative analysis had been ever done for the seasonal variation, which aggravated the researcher to analyze the same.
Material and methods
Area of Study
Jaipur district is administered by 13 blocks and 13 tehsils and has a geographical area of 11,151 sq. km that constitutes the East-central part of Rajasthan, which covers approximately 3.3% of the total area of the Rajasthan State. Jaipur district is the semi-arid zone that receives a normal annual rainfall of 527mm and the average annual rainfall is 565mm for the last 30 years. 90% of the total annual rainfall is observed during monsoon (Singh et al., 2012).
Therefore, Amer Block of Jaipur is carefully chosen as a study area. The climate of the territory is hot semiarid with limits of temperature range from 15-45°C having normal precipitation around 650 mm. The location of the study area has been shown in Figure-1.
Fifty villages of Amer Tehsil of Jaipur District in Rajasthan have been selected for the present study and are as follows- Amber, Atal Bihari Pura, Araniya, Takeda Chod, Achrol, Akeda Doongar, Bagawada, Beelpur, Bilonchi, Bugaliya, Bichandi, Deep Pura, Dabadi, Dhand, Daulatpura, Hathi Gram Bock-B, Jalsu, Jahota, Jajolai, Khora Meena, Kanwar Pura, Kishan Pura, Kukas, Lakher, Labana, Lalpura, Mahapur Macheri, Nangal Surawatan, Nagal Siras, Punana, Radha Kishanpura, Rampura, Sirohi, Sisyo Bas, Chandwali, Chalarpura, Chhaparadi, Chittanu Kalan, Chonp, Jairampura, Kant, Mundota, Rundal, Roida, Raithal, Sewapura, Shubhhrampura, Shyampura, Khannipur. 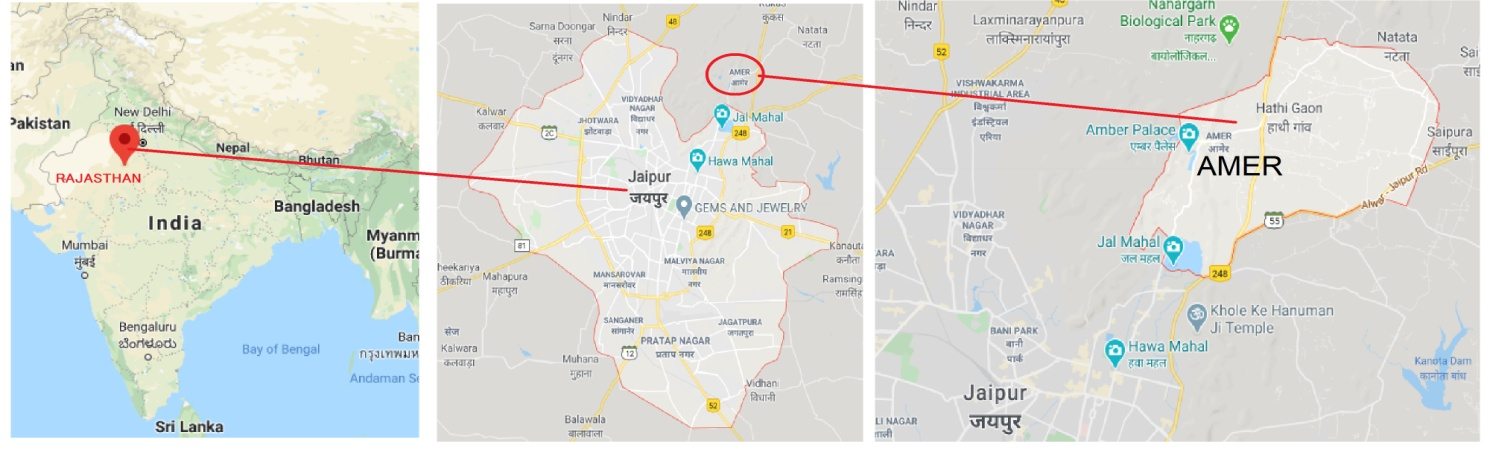
Figure 1: The location of the study area
Sample collection and physiochemical investigations
The groundwater tests are gathered from tube wells and hand siphons of fluctuating profundities. The water sample of about 2 liters from each sampling site has collected in pre-cleaned and rinsed polythene bottles. In the present study, the total number of samples total water collection in the year of 2017 that divided into two seasons, one is pre which includes pre- and post-monsoon Monsoon (April) and another one is postseasons, 260 (130 in each season) monsoon (September and October). Grab groundwater samples were collected. Sampling is applied during the sampling. With standard analytical methods, the analysis of water samples was carried out accordingly (APHA 2005, De 2002). Methods utilized in the physiochemical investigations on water samples depicted in Table-1.
Table 1: Parameters and methods utilized in the physiochemical investigations on water samples
| S.no | Parameter | Method Employed |
| 1 | Total Hardness (ppm) | Titrimetric Method |
| 2. | pH | Digital pH Meter |
| 3 | TDS (ppm) | Digital Conductivity Meter |
| 4. | Free Cl2 (ppm) | Titrimetric Method |
| 5 | Alkalinity (ppm) | Titrimetric Method |
| 6. | Free CO2 (ppm) | Titrimetric Method |
| 7 | Electrical Conductivity (mS) | Digital Conductivity Meter |
Correlation and Regression Analysis
The correlation investigation is applied to depict the level of correlation between the two boundaries. The linear regression analysis was carried out for the water quality parameters having highly significant correlation coefficients (0.8<r<1.0) and moderate significant correlation coefficients (0.6<r<0.8) and found to have a better and higher level of significance with their correlation coefficients.
Result and Discussion
In this study, the correlation coefficients (r) of different water quality boundaries have been determined. The correlation coefficient (r) between any two boundaries, x and y are determined for boundaries, for example, water pH, all-out alkalinity, complete hardness, calcium, magnesium, chloride, nitrate, fluoride, absolute broke up solids, and electrical conductivity of the groundwater tests. The level of line relationship between any two of the water quality boundaries is estimated by the basic correlation coefficient (r) is introduced as a 10 x 10 correlation lattice. A positive correlation is acquired between 39 mixes have 70.90% of the all out the number and rest 16 mixes have 29.09% display a negative relationship in both pre- and post-storm seasons.
In pre-monsoon season pH has been found to show a positive correlation with total alkalinity and fluoride and negative correlations with total hardness, calcium, magnesium, chloride, nitrate, total dissolved solids, and electrical conductivity. EC has a negative correlation with pH and fluoride while all other parameters are positively correlated with EC. Out of the 55 correlation coefficients, 6 correlation coefficients (r) between the Calcium-TH (0.9861), Magnesium-TH (0.9912), Mg-Ca (0.9555), TDS-Cl– (0.9130), EC-Cl– (0.9129) and ECTDS (0.9999) are observed with highly significant levels (0.8< r < 1.0). A high positive correlation of TDS and Cl– with EC indicates the high mobility of ions, while a high correlation of Total Hardness with Ca+2 and Mg+2 exhibits that hardness is mainly due to the presence of Ca+2 and Mg+2 salts in water. 8 correlation coefficients give the moderate significant (0.6< r < 0.8) level of r values and there is only one value of r which belongs to the significant coefficient levels (0.5< r < 0.6) Cl–-Ca+2 (0.5932) (Table-2).
In pre-monsoon season, R2 values indicate that 97.23% and 98.24% total hardness can be explained by calcium and magnesium respectively. 91.29% of calcium can be explained by magnesium. TDS can explain 83.35% chloride while EC can explain 83.34% of chloride and 99.98% TDS can be explained by EC. The values of adjusted R2 are very close to R2 values that mean the variables have adequate predictive ability for dependent variables. Out of the six significance values, five are under 0.05 so almost all the variables are significant (Table-2).
In post-monsoon season, EC shows a negative correlation only with pH, and with all rest parameters it has a positive correlation, in pre-monsoon, it was having a negative correlation with fluoride. Fluoride is indicating a positive correlation with only 4 parameters namely pH, TA, TDS, and EC while nitrate is representing a negative correlation with pH and TA, just opposite to the nature of fluoride (Table-3).
In post-monsoon season, EC shows a negative correlation only with pH, and with all rest parameters, it has a positive correlation, in pre-monsoon, it was having a negative correlation with fluoride. Fluoride is indicating a positive correlation with only 4 parameters namely pH, TA, TDS, and EC while nitrate is representing a negative correlation with pH and TA, just opposite to the nature of fluoride. Out of the 55 correlation coefficients, 6 correlation coefficients (r) between the Ca+2-TH (0.9833), Mg+2-TH (0.9898), Mg+2-Ca+2 (0.9475), TDS-Cl– (0.9116), EC-Cl– (0.9116) and EC-TDS (0.9999) are observed with highly significant levels (0.8< r < 1.0). These values also provide the same conclusion, drawn in the pre-monsoon season. 7 values of the correlation coefficient (r) fall in the category of moderate significant levels (0.6< r < 0.8) and 2 value between TDS-Ca+2 and EC-Ca+2 are classified under the significant levels of correlation coefficient (0.5< r < 0.6) (Table-3).
The regression equation (Y = aX+b) obtained from the analysis are given for both pre- and post-monsoon seasons. The different dependent characteristics of water quality were calculated by using the developed regression equations and by substituting the values for the independent variables in the equations. Linear regression equations are developed with the assumption that “change independent variable (Y) is either directly or indirectly proportional to the change in the independent variable (X) (Figure-2, Table-4, 5).
Table 2: Correlation matrix of water quality parameters in pre-monsoon season
| Parameter | pH | TA | TH | Ca+2 | Mg+2 | Cl– | No3- | F– | TDS | EC |
| pH | 1.0000 | |||||||||
| TA | 0.1225 | 1.0000 | ||||||||
| TH | -4690 | -0.0085 | 1.0000 | |||||||
| Ca+2 | -0.4616 | -0.0421 | 0.9861 | 1.0000 | ||||||
| Mg+2 | -0.4657 | 0.0183 | 0.9912 | 0.9555 | 1.0000 | |||||
| Cl– | -0.3484 | 0.0623 | 0.6414 | 0.5932 | 0.6131 | 1.0000 | ||||
| No3- | -0.0767 | 0.0122 | 0.3409 | 0.3017 | 0.3652 | 0.2947 | 1.0000 | |||
| F– | 0.2015 | 0.4017 | -0.1816 | -0.1688 | -0.1881 | -0.2339 | -0.0958 | 1.0000 | ||
| TDS | -0.2449 | 0.2384 | 0.6848 | 0.6312 | 0.7137 | 0.9130 | 0.3373 | -0.0731 | 1.0000 | |
| EC | -0.2448 | 0.2385 | 0.6847 | 0.6312 | 0.7136 | 0.9129 | 0.3372 | -0.0729 | 0.9999 | 1.0000 |
Table 3: Correlation matrix of water quality parameters in post monsoon season
| Parameter | pH | TA | TH | Ca+2 | Mg+2 | Cl– | No3- | F– | TDS
|
EC |
| pH | 1.0000 | |||||||||
| TA | 0.0892 | 1.0000 | ||||||||
| TH | -0.2515 | -0.1116 | 1.0000 | |||||||
| Ca+2 | -0.2165 | -0.1262 | 0.9833 | 1.0000 | ||||||
| Mg+2 | -2731 | -0.0976 | 0.9898 | 0.9475 | 1.0000 | |||||
| Cl– | -0.1684 | 0.1079 | 0.6895 | 0.6383 | 0.7137 | 1.0000 | ||||
| No3- | -0.0647 | -0.1857 | 0.3858 | 0.4497 | 0.3269 | 0.1224 | 1.0000 | |||
| F– | 0.1238 | 0.4104 | -0.1419
|
-0.1412 | -0.1391 | -0.0608 | -0.0932 | 1.0000 | ||
| TDS | -0.1402 | 0.3048 | 0.6380
|
0.5788 | 0.6695 | 0.9116 | 0.1129 | 0.0867 | 1.0000
|
|
| EC | -0.1401 | 0.3048 | 0.6381
|
0.5789 | 0.6696 | 0.9116 | 0.1129 | 0.0868 | 0.9999
|
1.0000
|
Table 4: Regression equation for pairs of parameters having highly significant correlation coefficients (0.8<r<1.0) in pre-monsoon season
| Pairs of
Parameters |
Correlation Coefficient | R2 | Adjusted
R2 |
Regression Coefficients | Regression Equation | p Value | |
| X-Y | R | a | b | Y=aX+b | sig. | ||
| Ca-TH | 0.9861 | 0.9723 | 0.9715 | 5.5118 | 14.9451 | TH= 5.5118 Ca + 14.9451 | 0.02 |
| Mg-TH | 0.9912 | 0.9824 | 0.9819 | 7.2336 | -1.5989 | TH= 7.2336 Mg – 1.5989 | 0.24 |
| Mg-Ca | 0.9555 | 0.9129 | 0.9103 | 1.2473 | -0.6484 | Ca= 1.2473 Mg – 0.6484 | 0.02 |
| TDS-Cl | 0.913 | 0.8335 | 0.8286 | 0.2985 | –
252.552 |
Cl= 0.2985
TDS 252.552 |
0.00 |
| EC-Cl | 0.9129 | 0.8334 | 0.8285 | 0.2089 | –
252.458 |
Cl = 0.2089
EC – 252.458 |
0.00 |
| EC-TDS | 0.9999 | 0.9998 | 0.9997 | 0.6999 | 0.2287 | TDS =
0.6999 EC + 0.2287 |
0.02 |
Table 5: Regression equation for pairs of parameters having highly significant correlation coefficients (0.8<r<1.0) in post-monsoon season
| Pairs of
Parameters |
Correlation Coefficient | R2 | Adjusted R2 | Regression Coefficients | Regression Equation | p value | |
| X-Y | R | a | b | Y=aX+b | sig. | ||
| Ca-TH | 0.9833 | 0.9669 | 0.9659 | 5.5289 | 14.4578 | TH= 5.5289
Ca + 14.4578 |
0.04 |
| Mg-TH | 0.9898 | 0.9797 | 0.9791 | 7.1647 | 1.4224 | TH= 7.1647 Mg + 1.4224 | 0.80 |
| Mg-Ca | 0.9475 | 0.8978 | 0.8948 | 7.1647 | 0.5590 | Ca= 1.2198 Mg + 0.5590 | 0.81 |
| TDS-Cl | 0.9116 | 0.8310 | 0. 8260 | 0.2525 | -145.161 | Cl= 0.2525
TDS 145.161 |
0.00 |
| EC-Cl | 0.9116 | 0.8310 | 0.8260 | 0.1767 | -145.152 | Cl = 0.1767
EC – 145.152 |
0.00 |
| EC-TDS | 0.9999 | 0.9998 | 0.9997 | 0.7000 | 0.0672 | TDS =
0.7000 EC + 0.0672 |
0.34 |
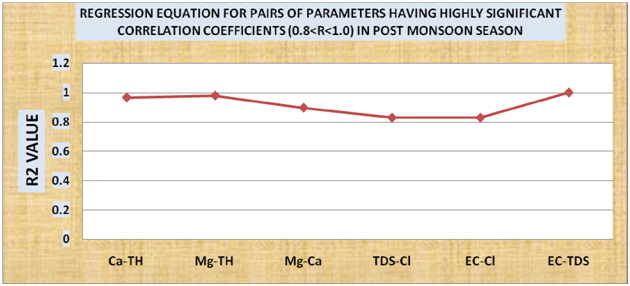
Figure 2: Regression equation in post monsoon season
Conclusion
The present study is focused on the groundwater quality of Amer of the Jaipur area. Physico-chemical parameters indicate the quality of groundwater. Most of the parameters like EC, TDS, Chloride, and Turbidity were found to have the highest concentrations during the study period. Total dissolved solids and chloride concentrations recorded exceeded the BIS permissible level and indicate the overexploitation of groundwater and low groundwater percolation rate into the soil. In our study better water quality was found in the Pre-monsoon season than that of Post monsoon season. The extent of pollution that occurred may be due to over-exploitation of groundwater, urbanization, and anthropogenic activities.
References
APHA, “Standard Methods for the examination of water and wastewater”, APHA, AWWA, WPCF, Washington DC USA, 21 st ed.2005.
Arif, M., Hussain, I., Hussain, J., Sharma, S., & Kumar, S. (2012). Fluoride in the drinking water of Nagaur Tehsil of Nagaur district, Rajasthan, India. Bulletin of environmental contamination and toxicology, 88(6), 870-875.
Bhalla, L. R., & Bhalla, K. (2013). Contemporary Rajasthan. Kuldeep Publication India.
Darbi, A., Viraraghavan, T., Butler, R., & Corkal, D. (2003). Column studies on nitrate removal from potable water. Water, Air, and Soil Pollution, 150(1-4), 235-254.
De A.K., (2002), Environmental Chemistry 4th Edition, New Age International Publishers, New Delhi, pp 245252.
Dhindsa, S. S. (2004). Ground water quality status of Rajasthan-2001, Validated up to 31-03-2003, Technical Paper. In National workshop on control and mitigation of excess fluoride in drinking water, Govt. of Rajasthan and UNICEF, Jaipur, Rajasthan, India.
Hussain, J., Sharma, K. C., & Hussain, I. (2004). Fluoride in drinking water and health hazards: Some observations of fluoride distribution in Sahara Tehsil of Bhilwara District, Rajasthan. Bioscience and Biotechnology Research Asia, 2(2), 107-116.
Sameer, V., Hampannavar, U. S., & Purandara, B. K. (2011). Assessment of chloride concentration in groundwater: A case study for Belgaum City. International journal of environmental sciences, 2(1), 271-280.
Saxena, S., & Saxena, U. (2013). Study of fluoride contamination status of ground water in Bassi Tehsil of district Jaipur, Rajasthan, India. International journal of environmental sciences, 3(6), 2251-2260.
Saxena, S., Saxena, U., & Sinha, A. K. (2018). Spatial and Seasonal Variability of Physico-Chemical Characteristics of Ground Water in Bassi Tehsil, Jaipur, Rajasthan, India. International Journal of Research and Scientific Innovation, 5(1), 145-162.
Saxena, U., & Saxena, S. (2015). Correlation study on physico-chemical parameters and quality assessment of ground water of bassi tehsil of district Jaipur, Rajasthan, India. Int J Environ Sci Technol, 1(1), 78-91.
Saxena, U., & Saxena, S. (2015). The statistical assessment of fluoride and nitrate contamination status of ground water in various tehsils of district Jaipur, Rajasthan, India. Int. J. Res. Stu. Biosci, 3(3), 106-130.
Singh, O. P., Singh, S. S., & Kumar, S. (2012). Rainfall profile of Jaipur-report of Meteorological Centre. Jaipur, India Meteorological Department, Ministry of Earth Sciences, Government of India, New Delhi.
Singh, P., Rani, B., Singh, U., & Maheshwari, R. (2011). Fluoride contamination in ground water of Rajasthan and its mitigation strategies. Journal of pharmaceutical and bio-medical sciences, 6(6), 1-12.
Singh, P., Rani, B., Singh, U., & Maheshwari, R. (2011). Fluoride contamination in ground water of Rajasthan and its mitigation strategies. Journal of pharmaceutical and bio-medical sciences, 6(6), 1-12.
Yadav, A. K., Khan, P., & Sharma, S. K. (2010). Water Quality Index Assessment of Groundwater in Todaraisingh Tehsil of Rajasthan State, India-A Greener Approach. E-journal of Chemistry, 7.