Evaluation of Climate Indicators for Passive Solar Design Optimization
Fabrice Mwizerwa1, Mukesh Kr Gupta2
1Research scholar, Department of Civil Engineering, Suresh Gyan Vihar University, Mahal Road, Jaipur, Rajasthan 302025 (INDIA).
2Professor, Renewable and Sustainable Energy Studies, Suresh Gyan Vihar University, Mahal Road, Jaipur, Rajasthan 302025 ( INDIA).
Corresponding author email: mwizeretu@gmail.com
Abstract
The purpose of conducting this research work was for evaluating the climate indicators of Entebbe region for finding out how to optimize the outputs of passive solar design which are based on the design strategies that are very specific for Entebbe region. The method involved in this research is the use of an advanced energy designing tool software known as climate consultant which allows the user to identify every little weather detail of a place. The findings of this study suggested that the optimization of passive solar design can be achieved with the inclusion of the passive design strategies found on the psychrometric chart of the place.
Keywords: Climate indicators, passive solar design, passive design strategies, occupant comfort range, sustainability.
1.Introduction
In the pursuit of achieving sustainability in the building sector for the past few decades, it has been noticed that climate factors do have an important role in making buildings more energy efficient. This implies that the adoption of passive strategies which only rely on the natural resources which can be renewed can extremely reduce the conventional way in which buildings consume energy [1-5].
People’s economic growth is usually accompanied with a certain degree of trying to improve the level of comfort in their residence which is unfortunately most of the time done by using other means that are not environmental friendly. It is true that not all types of climate can only depend on passive strategies for providing comfort to their occupants, but optimizing the use of all natural renewable resources available before adopting active strategies can reduce the building’s footprint on the ecosystem [6-10].
The global ongoing challenge of climate change has made the building designers and architects extend their boundaries in the search of building that can exhibit a dynamic response for each seasonal change. The approach to be used to make this dynamic response of buildings possible is through the inclusion of climate indicators that are specific for each region during the initial phase design of buildings [11-15].
The climate indicators that are evaluated in this study belong to Entebbe location. Climate indicators such as dry bulb temperature, humidity level, sky cover, ground temperature and the psychrometric chart of the location will be represented in a graphical form for the purpose of visualizing every little climate detail of the location.
- Methodology
To ensure that every little climate detail is taken into account, an advanced energy designing tool named as climate consultant software was adopted for this purpose. The software used in this study allows the user to choose the desired location in which the analysis has to be done, after the selection of the location the user has to decide the type of standard to be followed during the whole process of data analysis. In this study the ASHRAE standard 55 was opted as the guiding standard for this analysis.
- Analysis
The below table exhibits all the type of climate data involved in this analysis
Table 1. Climate data involved in the analysis
| Monthly means | January | February | March | April | May | June | July | August | September | October | November | December | Units |
| Global horizontal radiation(average hourly) | 491 | 511 | 520 | 452 | 416 | 418 | 442 | 456 | 472 | 518 | 467 | 496 | Wh/sqm |
| Direct normal radiation(average hourly) | 416 | 418 | 393 | 265 | 272 | 313 | 337 | 329 | 312 | 408 | 344 | 437 | Wh/sqm |
| Diffuse radiation(average hourly) | 196 | 203 | 210 | 243 | 212 | 186 | 190 | 201 | 226 | 197 | 213 | 191 | Wh/sqm |
| Global horizontal radiation(maximum hourly) | 1032 | 1073 | 1075 | 1025 | 954 | 919 | 953 | 1000 | 1025 | 1065 | 1022 | 1009 | Wh/sqm |
| Direct normal radiation(maximum hourly) | 892 | 886 | 873 | 826 | 847 | 844 | 847 | 846 | 858 | 880 | 860 | 897 | Wh/sqm |
| Diffuse radiation(maximum hourly) | 462 | 512 | 490 | 484 | 546 | 442 | 472 | 456 | 526 | 481 | 468 | 470 | Wh/sqm |
| Global horizontal radiation(average daily total) | 5894 | 6132 | 6249 | 5427 | 4999 | 5017 | 5306 | 5476 | 5670 | 6219 | 5611 | 5952 | Wh/sqm |
| Direct normal radiation(average daily total) | 4993 | 5026 | 4724 | 3187 | 3268 | 3760 | 4053 | 3951 | 3745 | 4902 | 4134 | 5243 | Wh/sqm |
| Diffuse radiation(average daily total) | 2359 | 2444 | 2530 | 2916 | 2546 | 2240 | 2291 | 2422 | 2716 | 2375 | 2557 | 2298 | Wh/sqm |
| Global horizontal illumination(average hourly) | 57599 | 60285 | 61372 | 52425 | 48440 | 48508 | 52139 | 53687 | 55448 | 61233 | 54654 | 58179 | Lux |
| Direct normal illumination(average hourly) | 25825 | 25579 | 25245 | 17993 | 17622 | 20993 | 21344 | 20805 | 19986 | 25900 | 21749 | 26557 | Lux |
| Dry bulb temperature(average monthly) | 22 | 23 | 23 | 22 | 22 | 22 | 22 | 21 | 22 | 22 | 22 | 22 | Degree 0C |
| Dew point temperature(average monthly) | 19 | 18 | 18 | 19 | 19 | 19 | 17 | 18 | 18 | 18 | 18 | 18 | Degree 0C |
| Relative humidity(average monthly) | 80 | 74 | 77 | 81 | 85 | 84 | 76 | 82 | 81 | 79 | 81 | 79 | Percent |
| Wind direction(monthly mode) | 180 | 160 | 250 | 180 | 180 | 180 | 190 | 0 | 0 | 240 | 240 | 240 | Degrees |
| Wind speed(average monthly) | 2 | 2 | 1 | 2 | 3 | 3 | 2 | 2 | 2 | 2 | 2 | 2 | m/s |
| Ground temperature(average monthly of 3 depths) | 21 | 21 | 22 | 22 | 22 | 22 | 22 | 22 | 22 | 22 | 21 | 21 | Degree 0C |
3.1 Temperature variation
As it can be clearly seen from the figure below, the temperature variation of this location does not swing away from the comfort zone which is shown on the legend section of this figure on the left.
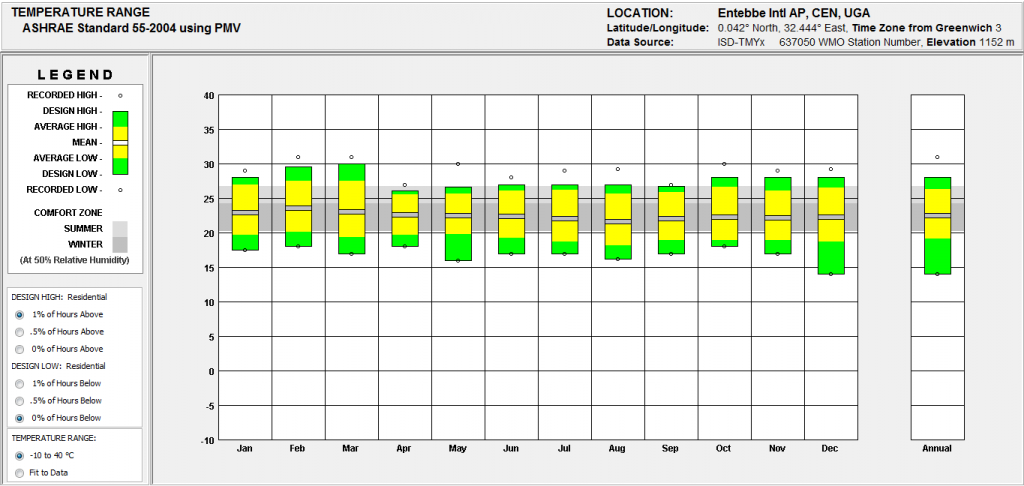
Figure 1. Temperature variation
3.2 Monthly diurnal variation
From this figure below six variables are represented together on the same graph, these variables are: dry bulb mean temperature, wet bulb mean temperature, dry bulb temperature, global horizontal radiation, direct normal radiation and diffuse radiation. Maximum radiation is observed in the month of march and October.
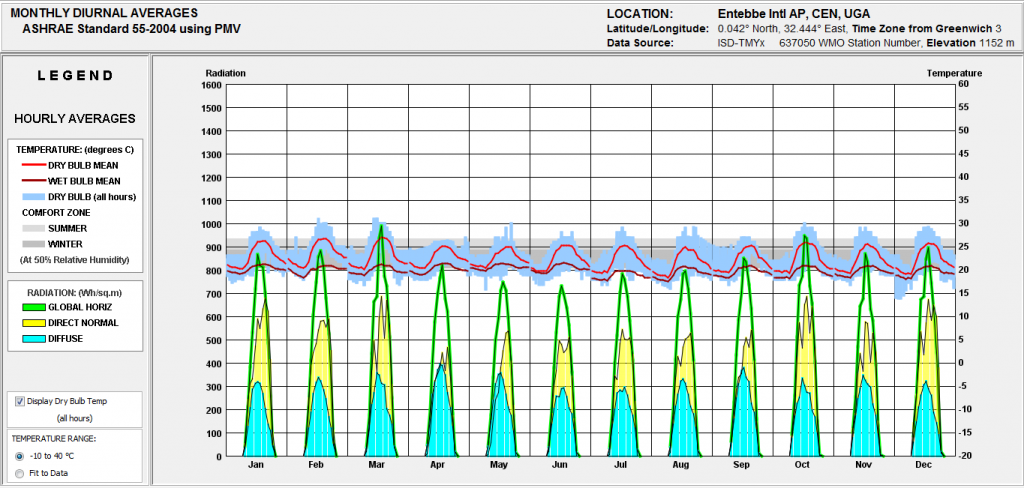
Figure 2. Monthly diurnal variation
3.3 Sky cover range
The sky cover range shown in the figure below shows how much does the chosen place gets cloudy or completely clear in each month of the year.
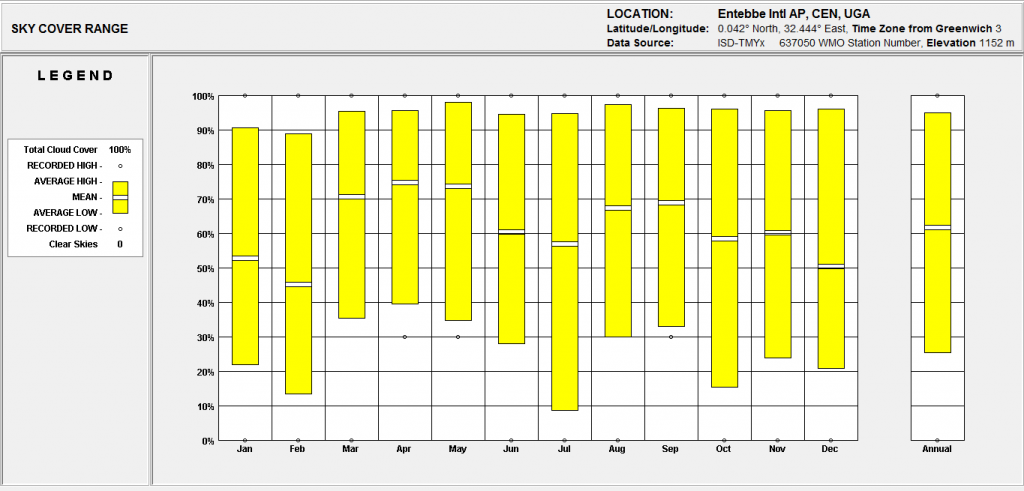 Figure 3. Sky cover range
3.4 Ground temperature variation
Ground temperature is taken into account when there is a need of installing earth air tunnel or during the construction of a specific foundation required to be maintained at some specific temperatures. Figure below exhibits the ground temperature variation for 0.5 meters, 2.0 meters and 4.0 meters below the ground level.
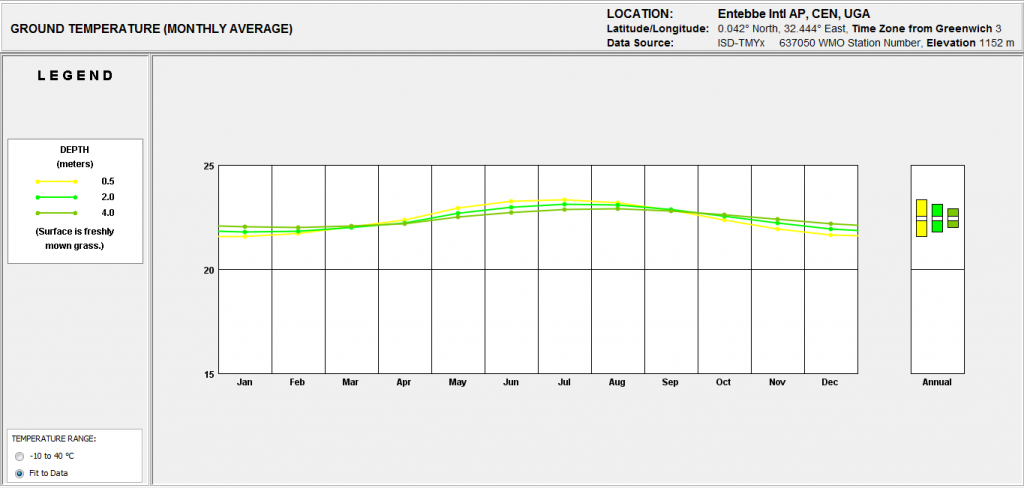
Figure 4. Ground temperature variation
3.5 Temperature and relative humidity variation
Temperature and relative humidity of a place are two major factors that influence the way people judge the thermal comfort satisfaction of a place. This figure below exhibits their variation along the year.
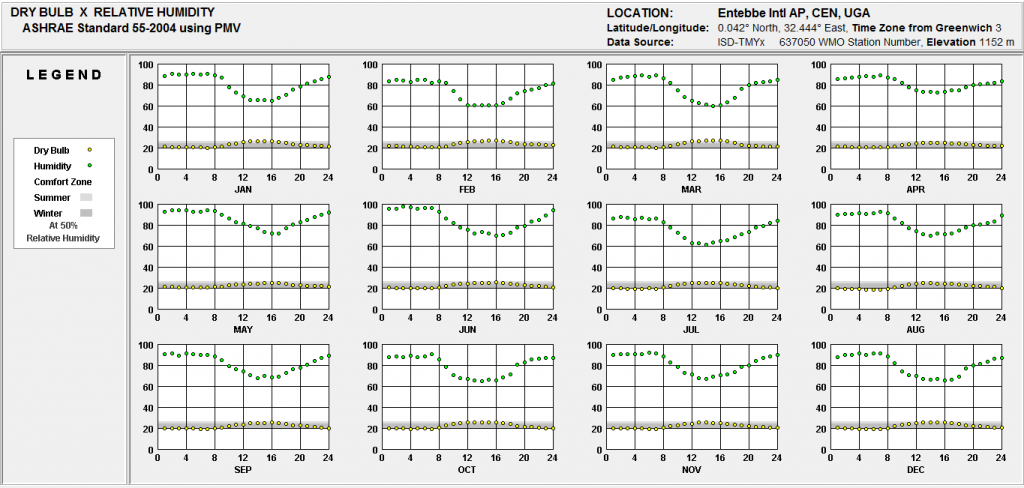
Figure 5. Temperature and relative humidity variation
3.6 Sun shading chart
Knowing the exact position of the shading device which can provide full shade whenever required is one of the important steps in establishing the required shade of a place. Figure below shows the sun shading chart of this location.
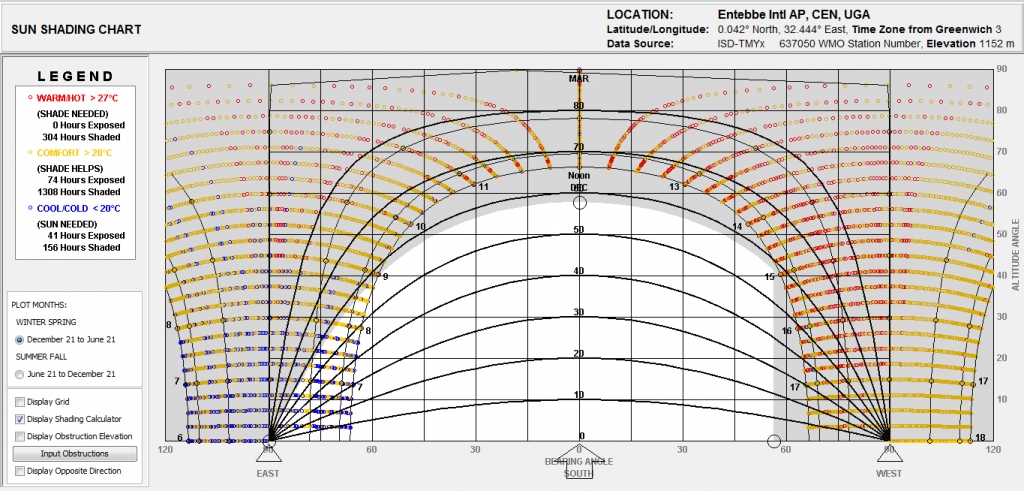
Figure 6. Sun shading chart
3.7 Psychrometric chart
This is the chart from which the user can choose the right passive design strategies that can offer both environmental and economical benefits.
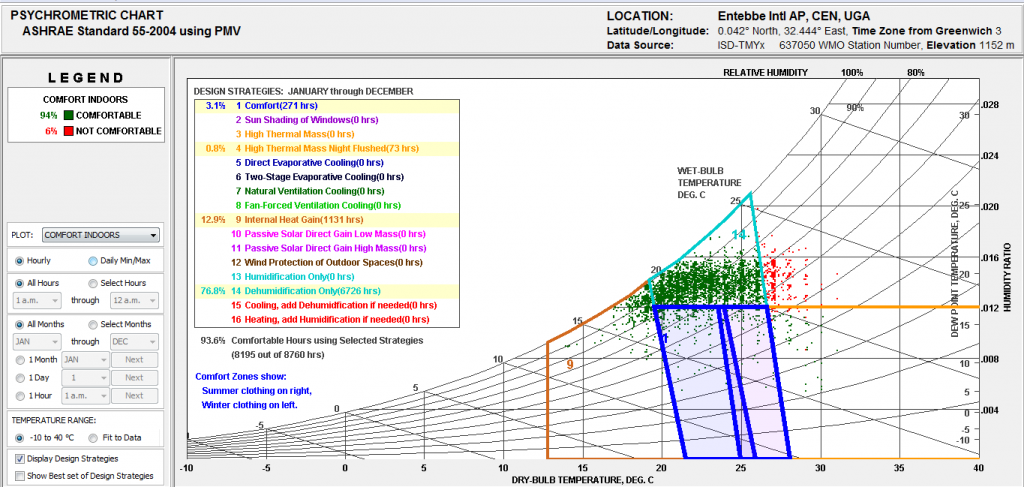
Figure 7. Psychrometric chart
- Results and discussions
Based on the analysis conducted and with the help of the design strategies suggested on the psychrometric chart, following points can be deduced.
4.1 High thermal mass night flushed
The use of high thermal mass materials inside the building requires a consistent procedure of cooling down these materials at the night time by the help of the cool outdoor air. This is done for optimizing the capability of these high thermal mass materials to absorb or store the solar heat during the daytime of the following day.
4.2 Internal heat gain
In the night time when the indoor temperature become less inferior to the ambient room temperature there is a requirement of a heating source, this heat required can be generated from the thermal mass materials available inside of the buildings. Thus the heat stored in the daytime by the thermal mass materials of the building has to be released so as to raise the temperature back to the comfort zone.
4.3 Dehumidification only
As observed on the temperature and relative humidity variation graph, the place experiences a lot of moisture in the air which makes it to be too much humid. Implementing dehumidification can be done through the use of natural ventilation means in the building. This is to say that the building must be provided with enough of air inlets opening to allow the outdoor air to flush out the humid air present inside the building.
- Conclusion
Having observed the way all climate indicators vary, adopting a passive solar design approach can be achieved easily through the inclusion of passive design strategies seen on the psychrometric chart. Taking into account the high humidity observed, the incorporation of natural ventilation means is very imperative for maintaining a healthy indoor environment.
References
- Daemei AB, Eghbali SR, Khotbehsara EM. Bioclimatic design strategies: A guideline to enhance human thermal comfort in Cfa climate zones. Journal of Building Engineering. 2019 Sep 1;25:100758.
- Pajek L, Košir M. Can building energy performance be predicted by a bioclimatic potential analysis? Case study of the Alpine-Adriatic region. Energy and Buildings. 2017 Mar 15;139:160-73.
- Pajek L, Košir M. Implications of present and upcoming changes in bioclimatic potential for energy performance of residential buildings. Building and Environment. 2018 Jan 1;127:157-72.
- Couvelas A. Bioclimatic building design theory and application. Procedia Manufacturing. 2020 Jan 1;44:326-33.
- Givoni B. Comfort, climate analysis and building design guidelines. Energy and buildings. 1992 Jan 1;18(1):11-23.
- De Dear RJ, Brager GS. Thermal comfort in naturally ventilated buildings: revisions to ASHRAE Standard 55. Energy and buildings. 2002 Jul 1;34(6):549-61.
- Nicol JF, Humphreys MA. Adaptive thermal comfort and sustainable thermal standards for buildings. Energy and buildings. 2002 Jul 1;34(6):563-72.
- Ottelé M, Perini K, Fraaij AL, Haas EM, Raiteri R. Comparative life cycle analysis for green façades and living wall systems. Energy and Buildings. 2011 Dec 1;43(12):3419-29.
- Singh MK, Mahapatra S, Atreya SK. Thermal performance study and evaluation of comfort temperatures in vernacular buildings of North-East India. Building and environment. 2010 Feb 1;45(2):320-9.
- Van Hoof J, Hensen JL. Quantifying the relevance of adaptive thermal comfort models in moderate thermal climate zones. Building and Environment. 2007 Jan 1;42(1):156-70.
- Goudarzi H, Mostafaeipour A. Energy saving evaluation of passive systems for residential buildings in hot and dry regions. Renewable and Sustainable Energy Reviews. 2017 Feb 1;68:432-46.
- Papparelli A, Kurban A, Cunsulo M. Strategies for bioclimatic design in an urban area of an arid zone: San Juan (Argentina). Landscape and urban Planning. 1996 Jan 1;34(1):19-25.
- Cañas I, Martı́n S. Recovery of Spanish vernacular construction as a model of bioclimatic architecture. Building and Environment. 2004 Dec 1;39(12):1477-95.
- Di Leo S, Salvia M. Local strategies and action plans towards resource efficiency in South East Europe. Renewable and sustainable energy reviews. 2017 Feb 1;68:286-305.
- Spagnolo J, De Dear R. A field study of thermal comfort in outdoor and semi-outdoor environments in subtropical Sydney Australia. Building and environment. 2003 May 1;38(5):721-38.