1Sachin Sharma, 2Dr. K C Roy
1Associate Professor, Department of Computer Engineering, Rajasthan Institute of Information Technology 2Professor, Kautaliya Institute of Technology & Engineering
Abstract— Wireless Sensor Networks is the basis of upcoming era of internet of things. It forms the base of a network that can be integrated with a TCP/IP Network in which the sensor nodes can work in a coordinated way. Wireless Sensor Networks are becoming increasingly important in a number of applications ranging from military, wildlife to consumer electronic appliances. These networks are formed using battery powered, portable tiny sensing nodes called motes comprising of a microcontroller, a sensing device and radio for transmission. The Physical and MAC layer protocols of WSN are specified in IEEE 802.15.4 specifications, which accounts for Low Rate Wireless Personal Area Networks (LR-WPAN). These are short range communication networks in unlicensed frequency bands in which a typical Li-ion battery is expected to work even for 1.5 years or more without replacement. One critical aspect related with WSN is network lifetime. It is the time since the onset of the network till the time when the first node of the network runs out of its battery life. To maximize the network lifetime, policies are required to be implemented for low battery consumption in all the nodes as well as evenly battery consumption in all the nodes. Also, policies are required for clustering and data aggregation with some insight for computation (aggregation) on low profile hardware within stipulated latencies as per the application requirement. This paper, presents a generic model of WSN with a cost function to account for all the factors that affect network lifetime and latency.
Keywords— WSN, Clustering, Energy Consumption, MAC Sub-layer, Network Lifetime
I. INTRODUCTION
WSN are networks that are based on IEEE 802.15.4 specifications. These are also known as LR-WPAN (Low Rate Wireless Personal Area Networks). These networks consists of sensing devices, commonly referred to as motes, which senses some physical quantity and then transfers the measured value to some central computer for subsequent action. As the name suggests, these devices communicate wirelessly. Such a network finds tremendous applications ranging from commercial to scientific to academic domains. Popular examples of wireless sensor network deployments are fire sensors, temperature sensors, heat sensors, radiation sensors, humidity sensors, pressure sensors, etc. The applications of sensors are continuously increasing in the recent years for automation as well as other activities of daily life.
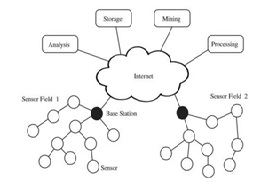
Fig. 1 Generic Illustration of Wireless Sensor Network
WSN forms the basis of Internet of Things which refers to the paradigm which is increasingly used now-a-days for home automation. This is the internet which is used by the consumer electronic devices to communication with each other and to make decision accordingly. For example, a refrigerator can send a request to a dairy booth or a milk supplier if it is programmed suitably to send a request in case it does not have milk on some Sunday morning. Applications similar to the one described above and much more in diversified domains can be built and there are endless possibilities for WSN changing the modern living to a larger extent, thereby turning the current internet to the Internet of things. A generic diagram of WSN is as shown in figure 1. Wireless Sensor Network design has several issues to be considered. The most important issues pertaining to all types of the wireless sensor network are Energy Efficiency and Latency. An overview of these issues is given below:
Energy Efficiency: This is the most critical aspect of almost all kind of deployments of WSN. As Wireless Sensor Networks are deployed in places at which the sensor node has to continuously monitor for some quantity for a prolonged time without getting out of the battery, the nodes need to be designed with the idea of low battery consumption. For example, a fire sensor at the ceiling of corridor of an office building must have to continuously sense for fire situation even for a year or long, so that in case of fire, the message regarding the same can be conveyed to some central computer to turn the alarms and to give an auto-call to the fire rescue team. WSN nodes are designed in such a way that it consumes very low power. Wireless Sensor network protocols are also low power consumption protocols. In fact, the IEEE standards for wireless sensor network nodes are also known as Low Rate and Low Power protocols [4]. Often, the battery life for a period of about one and a half or two years is common. This period is further increased by optimizing the duty cycle of the nodes. It refers to making the nodes periodically sleep for a certain period of time and then wakes up to sense the data. The energy consumption in the sleeping period is far less as compared to that in the wake-up or active period [5], thereby enhancing the battery life to a substantial limit. However, the sleep and wake up time are kept in the order of microseconds for most applications so as to satisfy the surveillance purpose of wireless sensor network.
Latency: The latency refers to the delay between the events of sensing something and the time instant at which the requisite action takes place. Most of the deployments of WSN come with the requirement of low latency. The requirement of high latency is critical for human rated systems such as radiation level sensors [6] in nuclear power plants and temperature sensors in thermal power plants. Latency beyond a certain limit is not permissible at all in systems and applications of IoT.
Wireless Sensor Network has conflicting requirements to run on Low Power Consumption and Low latency. As the networks are designed keeping in mind the factor of low energy consumption, the latency of the overall system increase. If fast circuit and/or large transmission range in incorporated in WSN to reduce latency, the energy consumption increases. Thus, the two requirements tend to conflict each other and an optimal solution needs to be developed as per the requirements of the deployment.
There are several other issues that need to be considered. The specifications for wireless sensor networks are standardized by IEEE in the specification for 802 wireless families of the specification. The IEEE 802 families of standards are specified for only Physical and MAC layers. The rest of the specifications are left to device manufacturers. Wireless Sensor Networks are specified under Wireless Personal Area Network (WPAN) Family of specifications and comes with IEEE 802.15.4 specifications [7]. These are low battery consumption and low data rate networks, thus are also abbreviated as LR-WPAN (Low Rate Wireless Personal Area Networks).
II. REVIEW OF IEEE 802.15.4 LR-WPN STANDARD
An (IEEE 805.15.4 comprises of Physical and MAC layer specification for Low Rate Wireless Personal Area Network (LR-WPAN). An LR-WPAN is an easy and inexpensive communication network that permits wireless connectivity in applications with good throughput requirements and limited power supply. The major objectives of an LR-WPAN are reliable data transfer, ease of installation, extremely low cost, short-range operation, and a rational battery life, at the same time as maintaining a flexible and simple protocol. Some of the features of an LR-WPAN are:
- Star or peer-to-peer operation
- Over-the-air data rates of 20 kb/s, 40 kb/s, and 250 kb/s
- Allocated 16 bit short or 64 bit extended addresses
- Carrier sense multiple access with collision avoidance (CSMA-CA) channel access
- Allocation of guaranteed time slots (GTSs)
- Fully acknowledged protocol for transfer reliability
- Low power consumption
- Energy detection (ED)
- Link quality indication (LQI)
There are two types of devices which can take part in an LR-WPAN network; reduced-function device (RFD) and a full-function device (FFD). FFD can function in three modes mainly as a personal area network (PAN) coordinator, device or a coordinator. An FFD can interact with other FFDs or RFDs, at the same time an RFD can interact with only to an FFD. An RFD is designed for applications that are exceptionally simple for example, a passive infrared sensor or a light switch. They may be associated with only single FFD at a time and may need to transfer the bulk of data. As a result, the RFD can be implemented using very few resources and memory capacity.
A system in agreement to IEEE 802.15.4 consists of numerous components. The essential one is the device. A device can be RFD or FFD. More than two devices within a POS interacting on the similar physical channel comprise of a WPAN. Though, a network shall contain at least one FFD, which is working as the PAN coordinator. IEEE 802.15.4 network is a division of the WPAN family of standards even though the exposure of an LR-WPAN may expand beyond the POS, which naturally defines the WPAN. Little changes in direction or position might result in radical differences in the signal quality or strength of the communication link. A clear coverage area does not exist for wireless media since propagation characteristics are uncertain and dynamic.
III. PERFORMANCE ANALYSIS OF CLUSTERING AND ENERGY CONSUMPTION IN CLUSTER BASED WIRELESS SENSOR NETWORK
3.1 Conflicting requirements of Clustering, Data Aggregation and Latency
A wireless sensor network has energy consumption as its most critical issue that needs to be treated most efficiently as the sensor nodes needs to be deployed at the places where these need not be serviced on a frequent basis. It is expected from a sensor node to continue its working on a single AA battery even for an year or two. For this reason, the sensor node uses low range radios to save energy in data transmission. One requirement of low transmission range radios is that the nodes need to be clustered so that those belongs to certain proximity can transmit the data to a single node called the cluster head coordinator or PAN (Personal Area Network) coordinator and the coordinator node then transmits the data to the sink node.
This clustering approach has two advantages. First, it reduces the need of long range radios to enable the transmission from all the nodes to the sink node. Secondly, it reduces the size of the data to be transmitted as a whole. It is because data aggregation can be done at the PAN coordinator and the consolidated data is transmitted to the sink node. This is particularly important in cases where the same information is recorded by several sensor nodes and supplied to the base station leading the data redundancy. Both these factors contribute towards reducing the energy consumption to a significant extent
However, the major drawback associated with clustering technique is the time delay that is introduced as a result of transmission to the sink via the PAN coordinator and the Data aggregation, thus affecting the real time characteristics of WSN. The data aggregation at some node which is a Cluster Head (CH) increases the latency and thus cannot be used above some specified threshold. Also, in clustering approach, a significant amount of energy overhead is associated with the cluster head selection and corresponding information dissemination to all the nodes of the cluster. Thus, it cannot be done on a frequent basis and need to be evaluated for optimization.
3.2 Network Deployment Model
The network model considered in this paper is applicable for large size and scalable WSN. The following consideration have be made in the model analysis:
- Each of the device/mote in the network is either an RFD (Reduced Function Device) or FFD (Full Function Device).
- The PAN Coordinator or the CH (Cluster Head) is a FFD chosen from the cluster nodes on a periodic basis. The PAN coordinator aggregates the data and transfers the summarized data to the sink node or any node on the path to the sink node.
A portion of the network model is shown in figure 2.
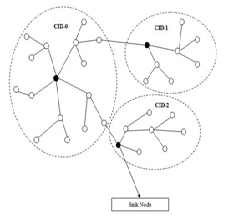
Fig. 2 Cluster Topology Network
In this network, the cluster heads are shown in black. The clusters are depicted in dotted lines. The cluster head is a node selected from the cluster based on certain parameters. The cluster formation is done by assigning the node ids to the individual nodes by the PAN coordinator. Each node then associates itself with some PAN coordinator within its transmission range.
3.2 Analytic Model of Relationship between Data Aggregation, latency and Energy Consumption
Table 1 clearly depicts that the requirements of Data Aggregation and Latency are conflicting and one needs to decide a suitable point in the optimal region of figure 4.1 for deployment of the specific type of sensor network.
| Parameter | Pros | Cons |
| Data Aggregation
|
Needs to be maximized so as to reduce the size of the data to be transferred and thus, low battery consumption in individual nodes | Needs to be maximized so as it requires high performance hardware to run aggregation software, resulting in increased cost of node. |
| Needs to be maximized in view of availability of high performance commodity hardware which is increasingly cheaper. | Needs to be minimalized as it induces latency in the network. | |
| Needs to be maximized as per the availability of high speed high performance cheap hardware | Needs to be minimized in view of cheap storage and high battery powered nodes. The detailed data can be used for analytics purpose. | |
| High Data Aggregation requires high level of clustering and progressive data aggregation. It requires additional energy consumption in cluster setup phase | Low data aggregation does not need extensive clustering. | |
| High level of clustering results in uneven battery consumption. To compensate this, clusters are to be formed on frequent basis which requires high energy overhead in cluster setup phase. | Less overhead of frequent cluster setup energy consumption. | |
| Latency | Latency is of least concern in a number of applications like wildlife sensing and other similar applications. | Need to be minimized in case of real time applications like radiation sensors and human medical diagnosis equipment. |
| High level of clustering results in high Latency | Low level of clustering results in low Latency but high transmission costs. |
The analytic estimation of a feasible solution of a particular deployment requires clear estimation of cost of energy consumption in setup phase and the number of rounds after which the subsequent leader election takes place in the cluster. However, a generic model can be deduced which is applicable for a large class of applications.
The goal of this work is to figure out a generalized mathematical model of the WSN considering the Clustering and data aggregation policies and to relate it to the energy consumption in the most accurate way as possible. This analysis basically investigates the network at the application layer and incorporates the first order radio energy model. For clustering of the network, the most commonly used LEACH (Low Energy Adaptive Clustering Hierarchy) protocol is used.
The importance of Data Aggregation can be figured out from a simple computation described as follows. Consider the following values for the transmission and processing circuitry energy consumption:
Energy Required per bit in the Processing Circuit : 50nJ/bit
Energy required per bit in the Transmission Circuit : 10pJ/bit/m2
For transmission of 1 kb for a distance of 1 km, the transmission circuit consumes 10X10-12*1024*1000*1000 = 0.01024 Joules.
For processing of 1kb, the processing circuit requires 50*10-9*1024 = 5.12X10⁻⁵. Thus, the ratio of energy consumed in Transmission and Processing is :
![]()
Thus 200 instructions can be executed for the same energy consumption as for the transmission of one instruction over the distance of 1 km. Moreover, it increases with the square of the distance. Thus, it is promising to use clustering techniques in WSN to allow for prolonged battery life.
The following parameters are considered for analytical model.
N : Number of nodes in the network.
A(= nXn) ; dimensions of the network.
E ; Initial Battery level of each node.
et : Energy expenditure per bit in each read operation in transmitting node.
ea : Energy expenditure per bit in amplifier and radio circuit in transmission of data corresponding to read operation to the CH.
er : Energy expenditure in each read operation in CH node. It is same as et.
R ; Read operations per second.
r ; Data packets per read operation.
k, Packet size in bits
C: Number of Clusters
te; time after which the CH election takes place
The Xbee devices available in the market for sensing temperature comes with specifications
1 read per 30 sec / 1.5 years
1 read per minute / 2.5 years
1 read per hour (or less frequent) / 6 years,
The above assumptions based on: Cyclic sleep enabled with single transmit per wake cycle; Ambient temperature at 21° C, with 3 X AA 1.5 V batteries.
3.3 Analytical Energy Dissipation Relationships
The optimal number of clusters for a given WSN is a function of node transmission range, node density, physical dimensions of the WSN and the network traffic. The following results can be made in a straightforward manner:

The last term is due to the fact that longer the transmission range, less number of clusters are required. The abstract view of the network is depicted in the figure 3.4. The shaded area shows the region of the cluster. All the nodes in the cluster influence region transfers the sensed data to the cluster head. The cluster head then transfer the data to the sink node or the next hop cluster head in the network.
Let the optimal number of clusters be C. Then the average number of nodes per cluster head is C/N. The Cluster head remains on its designation for a period te. The equations described above gives the energy expenditure of the span of any cluster as cluster head. The number of readings that the CH makes itself is te*R. The energy consumption in reading operation by the cluster head itself is
E1 = (te*R)*r*k*et
The energy consumption in the CH in read operation of data from all the Cluster members is:
E2 = (N/C)*(te*R) *r*k*et
The following two transmission policies by the CH may be possible :
- Data Aggregation and Data Transmission
- Data Aggregation and summerized Data Transmission
Corresponding to the first case, the transmission energy expenditure may be expressed as :
E31 = [(te*R)*r*k + (C/N)*(te*R) *r*k]*ea
If the consolidated data is reduced by a fraction k (k<1), then
E32 = k*E31.
Thus, corresponding to above two network models, the energy consumption in the cluster head is:
ECH = E1+E2+E31 or
ECH = E1+E2+E32
The energy consumption in each of the cluster member is
ECM,1 = (te*R)*r*k*et +(te*R)*r*k*ea
The energy consumption in all the cluster members in read operation during a CH span is
ECM = (N/C)*ECM,1
The Energy consumption in entire cluster in the steady state phase is thus:
Esteady state = ECH + ECM
It is assumed that the formation of the cluster is done on the basis of some cluster head selection protocol. The energy consumption overhead in the election of the CH can be computed on the basis of protocol specifications. However, despite of the choice of the cluster head selection algorithm, the process consists of the following two stages :
- Set-up Phase
- Steady State Phase
The energy consumption in the steady state phase is given by the above equations. The energy consumption in the setup phase is the overhead that accounts for the network management task.
The set-up phase for cluster formation and CH selection is the task of MAC layer. The PAN coordinator forms the first cluster by establishing itself as the cluster head (CLH) with a cluster identifier (CID) of zero, choosing an unused PAN identifier, and broadcasting beacon frames to neighboring devices. A candidate device receiving a beacon frame may request to join the network at the CLH. If the PAN coordinator permits the device to join, it will add the new device as a child device in its neighbor list. Then the newly joined device will add the CLH as its parent in its neighbor list and begin transmitting periodic beacons; other candidate devices may then join the network at that device. If the original candidate device is not able to join the network at the CLH, it will search for another parent device. The set-up phase consists of the following steps:
- Scanning through Channels
1.1 ED (Energy Detection) Channel Scan
1.2 Active Channel Scan
1.3 Passive Channel Scan
1.4 Orphan Channel Scan
- Starting of PAN
- Beacon Generation
- Device Discovery
The ED scan allows a prospective CH to select a frequency channel in which to operate prior to starting a new PAN. An active scan allows a CH to locate any coordinator transmitting beacon frames within its Personal Operating Space (POS). A passive scan, like an active scan, allows a device to locate any coordinator transmitting beacon frames within its POS. An orphan scan allows a device to attempt to relocate its coordinator following a loss of synchronization. During an orphan scan, the MAC sublayer shall discard all frames received over the PHY data service that are not coordinator realignment MAC command frames. The frame structure of the Beacon Frame is depicted as shown:
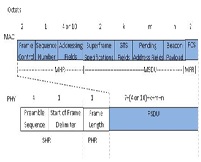
Fig 3 Structure of a Beacon Frame
A PAN shall be started by an FFD only after an active channel scan has been performed and a suitable PAN identifier selection has been made. A CH may indicate its presence on a PAN to other devices by transmitting beacon frames. This allows the other devices to perform device discovery
As indicated in figure 3.4, there are 4+1+1+7+(4 or 10)+k+m+n octets that are transferred in each frame beacon. It is assumed that 32 octats are required for MAC Beacon frame. The setup phase requires the a set of activities including scans and beacon signal broadcast for the establishment and configuration of PAN.
The energy consumption incurred in setup phase can be made on the basis of following :
- EED: The Energy Detection scan is used by the CH. For ED scan, the time spent in scanning each of the 27 valid channels is [aBaseSuperframeDuration * (2n + 1)] symbols, where n is the value of the ScanDuration parameter, with max value of n=14.
- EAS : The active scan is used by CH before, initiating a PAN. For each logical channel, the device shall first switch to the channel, and send a beacon request command. The device shall then enable its receiver for at most [aBaseSuperframeDuration*(2n + 1)] symbols, where n is a value between 0 and 14.
- The passive channel scan is used by any of the device trying to get associated with some PAN coordinator. For this analysis, it is assumed that all the cluster members perform passive scan after each round of CH selection.
- It is assumed that the wireless nodes are stationary and functions perfectly. Thus there is no need for any cluster member to perform orphan scan during or after any PAN establishment
- EFB : The beacon frame transmission (32 Octats) by the PAN coordinator and its reception by cluster members.
It is important to note that the abasesuperframe duration is fixed to 960 symbols in the spread sequence, where each symbol corresponds to 4 bit chip sequence.
Thus, the total energy consumption in the setup phase in each of the cluster is :
Esetup = EED + (N/C)*EAS + EFB
Thus, the overall battery power consumption in a cluster during the operation of any specific cluster head is
E = E setady state + E setup
Consider a network lifetime t during which t/te cluster head selections takes place and it corresponds to the max. network lifetime. In other words, it refers to the period since the beginning of the PAN till the time when the first node dies. The total energy consumption in a cluster during this time interval is:
Etotal = (t/te)*E
E total = (t/te)*( Esetady state + E setup)
The above analysis leaves us with the following optimization constraints:
- Network Lifetime needs to be maximized and to achieve it, the energy consumption in each of the devices must be even.
- E setup depends upon cluster size and needs to be minimized.
- Battery consumption in cluster head during steady state phase should be such that all the nodes continue to work while all nodes becomes cluster head at least once.
The requirements however are conflicting. More nodes per cluster means uneven battery consumption. Less nodes per cluster means evenly battery consumption but at the same time, more energy loss in setup phase at the time of formation of the PAN. Thus, optimal number of clusters and cluster span are the key parameters that needs to be optimized for any given network so as to achieve maximum network lifetime.
IV. CONCLUSION
The present work focuses on the Clustering and Energy Consumption tradeoff considering the first order radio energy dissipation model and provides analytical equation for the same. Based on this analysis, one can determine the optimal network configuration for particular deployment of the WSN.
This research follows a bottom up approach from data link layer performance modeling for clustering to data read operations at application layer and data transmission using specified schedule by cluster head. However, as a future scope of the work, the specifics of the underlying hardware technology is to also to be take into account as the power dissipation varies greatly with the type of technology used for the realization of the sensor mote. However, the results presented in this analysis are of qualitative importance in every type of realization, as the ratio of energy expenditure in setup phase and steady state phase holds the same in almost all the IC technologies.
References
- T. de Almeida Oliveira and E. P. Godoy, “ZigBee Wireless Dynamic Sensor Networks: Feasibility Analysis and Implementation Guide,” in IEEE Sensors Journal, vol. 16, no. 11, pp. 4614-4621, June1, 2016. doi: 10.1109/JSEN.2016.2542063
- Y. Zhang; M. Qiu; C. W. Tsai; M. M. Hassan; A. Alamri, “Health-CPS: Healthcare Cyber-Physical System Assisted by Cloud and Big Data,” in IEEE Systems Journal , vol.PP, no.99, pp.1-8 doi: 10.1109/JSYST.2015.2460747
- V. Stangaciu, D. Pescaru, M. V. Micea and V. Cretu, “Practical aspects regarding implementation of real time WSN applications based on IEEE 802.15.4,” Telecommunications Forum (TELFOR), 2013 21st, Belgrade, 2013, pp. 295-298. doi: 10.1109/TELFOR.2013.6716229
- M. Eskola, T. Heikkilä and P. Tukeva, “Deriving test procedures of Low-Rate Wireless Personal Area Networks,” Performance Evaluation of Computer and Telecommunication Systems (SPECTS), 2012 International Symposium on, Genoa, 2012, pp. 1-8.
- M. López et al., “Software management of power consumption in WSN based on duty cycle algorithms,” EUROCON, 2013 IEEE, Zagreb, 2013, pp. 399-406. doi: 10.1109/EUROCON.2013.6625014
- LaMeres et al., “Position sensitive radiation detector integrated with an FPGA for radiation tolerant computing,” Sensors, 2010 IEEE, Kona, HI, 2010, PP. 208-213. doi: 10.1109/ICSENS.2010.5690418
- N. Salman, I. Rasool and A. H. Kemp, “Overview of the IEEE 802.15.4 standards family for Low Rate Wireless Personal Area Networks,” Wireless Communication Systems (ISWCS), 2010 7th International Symposium on, York, 2010, pp. 701-705. doi: 10.1109/ISWCS.2010.5624516