Vol. 6 Issue 2 Page No- 52-57
Vinod Tukaram Wagh* and Dr.Ritu Gilhotra
Suresh Gyan Vihar University, Jaipur, Rajasthan, India.
| ABSTRACT
Famotidine (FAM) is poorly water-soluble H2 receptor antagonist and inter-individual variability in bioavaibility. The objective of this study was therefore to design optimized solid dispersion (SD) of FAM with hydrophilic carriers eg Kollidon by kneading method in an attempt to enhance to the aqueous solubility and therapeutic efficacy of drug phase solubility study. SD of FAM prepared by physically mixing and kneading method followed by dissolution studies. A comparative in-vivo study between optimized SD and FAM was conducted on six healthy rabbits. The dissolution rate of FAM from the kneaded dispersion was greatly enhanced as compared to those from physical mixture and pure drug. The in vivo studies indicated that the pharmacokinetic parameter following oral administration of the optimized SD and pure FAM were significantly different. The peak serum conc. (Cmax) for kneaded SD and FAM were found to be 596.33+0.84 ng/ml and 528.50+0.71 ng/ml resp. Whereas the time required to reach the peak serum conc. (Tmax) for optimized SD was Significantly shorter 1.5+0.04 hrs compared to that for FAM 2.00+0.02 hrs. The relative bioavaibility of SD under in-vivo test was found to be 120.98%. These results demonstrate that the use of a suitable hydrophilic carrier like kollidon to formulate SDs by the kneading technique can rapidly accelerates the solubility and in vitro dissolution of a lipophilic drug like FAM the suggested method also provides good signs of important in the rate of absorption as well as bioavaibility of Famotidine following oral administration. |
| Keywords:
Famotidine Kollidon |
Pharmacokinetics Rabbit plasma
INTRODUCTION
Oral solid dosage shows many advantages in comparison to other oral dosage form, because oral solid dosages easiest and simplest way of oral administration. These are shows the greater stability, accuracy, easy and smaller production. (1, 2). Large of new drug entities under development most drug shows effective in vivo plasma concentration. But most of new drug shows poorly aqueous solubility and not properly absorbed after orally drug administration (3, 4). Those drug are not properly released in GI tract area they will show low bioavailability. These are the major challenged in pharmaceutical industries to improve the solubility and dissolution rate. Various techniques are used to enhanced solubility and dissolution rate like salt formation, use of prodrug, micronization, use of surfactant. But most of the technique shows various limitations. Solid dispersion technique shows most effective effect like enhancement of solubility and dissolution. Because into solid dispersion decreased particle size, then increased surface area. Due to the increasing surface area shows increasing the wettabillity. In these study Selection of Famotidine drug because Famotidine is according to BCS classification class IV type drug those are shows the low aqueous solubility and low dissolution rate, and low bioavalabity (5, 6). Main object of study was to increased solubility, dissolution rate and bioavailability.
MATERIALS AND METHODS
Materials
FAM gift sample of Milan lab., kollidon purchased research lab fine chem. Industries, providone purchased pallav chem. ltd.
Physical mixture Preparation
Physical mixture prepared by FAM with providone k30 or kollidone in 1:1 ratio. The mixter accurately weighed quantity of FAM and carrier in using mortar and pestle. After mixing powder passed mesh no. 40. (7).
Solid dispersion preparation
Batch A1 to A8 are prepared by using kneading methods. Using eight different type of Drug and carriers (Kollidon and Povidone K30) ratio. Mixture of Drug and carrier triturated using a small volume of methanol. Which kneaded for 30 min. then dried at 400C in oven and stored in desiccators 4 Hrs, and passed mesh no. 60 (8, 9).
Dissolution study (In vitro)
In vitro dissolution studies performed using USP Type II dissolution apparatus. Drug release studies performed employing phosphate buffer pH 7.4 as dissolution media temperature of 37 0C at speed 50 rpm. Dissolution studies performed on pure drug 4 mg and different solid dispersion containing equivalent amount of drug. Periodically withdrawn 5 ml sample was analyzed spectrophotometrically at 265 nm.
Pharmacokinetic study (In vivo)
According to dissolution profile optimum solid dispersion was Famtidine: Kollidon 1:4 w/w prepare by kneading method were selected for comparison of in vivo performance vs plain Famotidine (10, 11).
Study design
Six (6) albino New Zealand Rabbits are used for study. There avg. weight 2.5 kg. The rabbits are divided 2 groups (3 of each group). All rabbits fasted overnight with adlibitum acces to water during experiment and the animals were fed 8 hours after the oral dose. One group of animals received a single dose of FAM (15mg/2ml), formulated as a suspension containing sodium carboxy methyl cellulose (equivalent to 0.5%w/w of the drug). Another second group dose administered solution containing kneaded FAM kollidon 1:5 w/w. Suspension administered orally by using feeding tube size 8, then 2 ml water to wash off remaining in feeding tube and alimentary tract. 1 ml blood sample collect using needle from shaved marginal ear vein into heparinzed eppendrof centiguge tube at interval of 0 to 8hrs. In to marginal ear Xylene is applied before withdrawals. Blood samples centrifuged immediately at 6000 rpm 10min to plasma separation ant store 4000C further analysis (12, 13).
Extraction of Famotidine from plasma
Sample of plasma was spiked with concentrations of Famotidine in acetronitrile obtain plasma conc. 100 ng/ml to 600 ng/ml and 10.0 μg/ml. 0.5 ml of spiked sample taken in centrifuge polypropylene tube, 0.5 ml acetonitrile added and vortexed sample for 30 sec. to ppt plasma protein. Chloroform 2ml added and sample was vortexes again 2 min. for extract Famotidine into organic layer. Mixture centrifuged at 3000 rpm for 15 minutes. Then 1 ml of organic layer transferred to clean glass vial and evaporated at costant temp. 400C. 1 ml of dry residue acetonitrile, diluted with 1 ml of of internal standard (1.5 μg/ml FAM in acetonitrile) and vortexed for 30 seconds. The resulting solution having a final internal standard concentration of 400ng/ml, 0.45 μ millipore filters was used to filter and Famotidine 100 ml sample was injected and analyzed using HPLC (14, 15).
Analysis of Famotidine by High Pressure Liquid Chromatography (HPLC)
The concentration of FAM in the plasma samples was analyzed by a standardized reverse phase HPLC method. The system consisted of a Agilent 12:20 Binary system with UV-detector, in‐line degasser and an auto‐sampler programmable coupled to a personal computer. Data and system management was handled by chromatography manager software. Buffer: acetonitrial mobile phase use at 45o C using a C18 column and run atflow rate 1 ml/ min. The 20μl sample injected with aliquots was loaded in an auto sampler tray in glass vials and eluting peaks moniter at 270 nm. The developed HPLC method was validated for linearity (100 to 600μg/ml), repeatability, and precision (16, 17).
Pharmacokinetic Parameters Estimation and Statistical Analysis
Results from HPLC analysis were plotted as drug concentration in plasma vs. time. Non compartment pharmacokinetic parameters including Tmax, Cmax and AUC were estimated by Kinetica 5.0 computer program. The AUC values for each curve were calculated from time zero to the last data point using the trapezoidal rule with extrapolation to infinity. The AUC0-_ values obtained from curve were used to calculate the relative bioavailability Results of in vivo experiments are reported as mean ± S.D Statistical tests of significance were performed using Graph Pad Prism 5.0 software. P value less than 0.05 consider significant (18).
RESULTS AND DISCUSSION
Dissolution Study (In vitro)
In vitro dissolution study comparison of pure drug, physical mixture and solid dispersion. The dissolution release profile showed in figures no 1 and 2. Drug release observation indicates the increased with concentration of carriers increasing dissolution rate up to certain limit, then after becomes constants. In comparison of Pure drug and solid dispersion and physical mixture, PM and SDs shows faster dissolution rate than pure drug. In the formulation A4 batch shows maximum rate after 30 min.
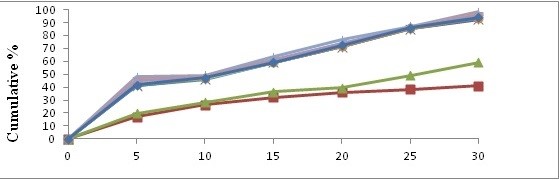
Figure 1: Dissolution study (In vitro) with Kollidon
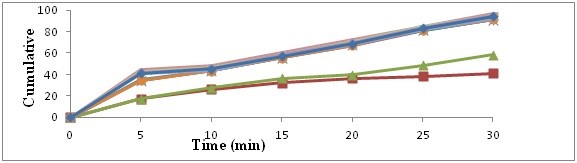
Figure 2: Dissolution study (In vitro) with Povidone K30
In-Vivo Pharmacokinetic Study
The oral administration of 15 mg dose of FAM or an equivalent of its 1:5 kneaded SD to 6 healthy rabbits and the mean pharmacokinetic parameters after administration of the drug and the solid dispersion are listed in table no.1. It is evident that there exists a clear difference between the biological performance of both the pure drug and the solid dispersion under test, which reflects itself by the significant difference (p<0.05) in the peak concentrations between both of them, determined using one way ANOVA. The maximum plasma level (Cmax) of 528.50 ± 0.71 ng/ml was attained after 2.0 ± 0.02 hours. On the other hand, the solid dispersion resulted in significantly rapid appearance of FAM in plasma, showing Cmax value of 596.33 ± 0.84 ng/ml after 1.5 ± 0.04 hours. While area under curveof pure drug AUCtot 1679.5 and SD AUCtot of 2030.66 The relative bioavailability of the kneaded solid dispersion was found to be 120.98% depicting an improvement in the efficacy of the drug.(figure 5) and (figure 6). With the increasing number of drug candidates which are poorly soluble, solid dispersions with hydrophilic carriers play an increasingly important role in pharmaceutical development, which was depicted in the present study. Successful solubilization of FAM was achieved using the Kneading technique and Kollidon (water soluble carrier). Based on the rapidly improved in vitro dissolution and in vivo absorption rate, it is very much evident that such formulations would be highly advantageous for the use of oral drug therapy, with faster onset of action and better therapeutic efficacy.
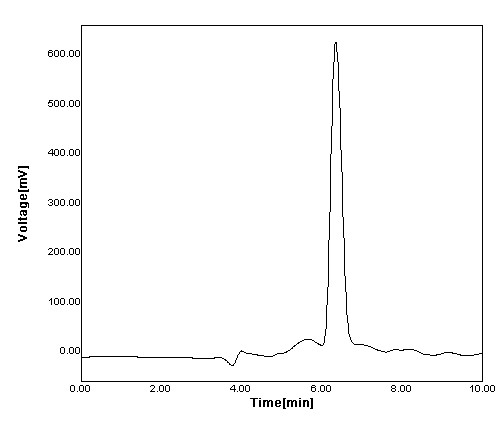
Figure 5: Chromatogram of Famotidine
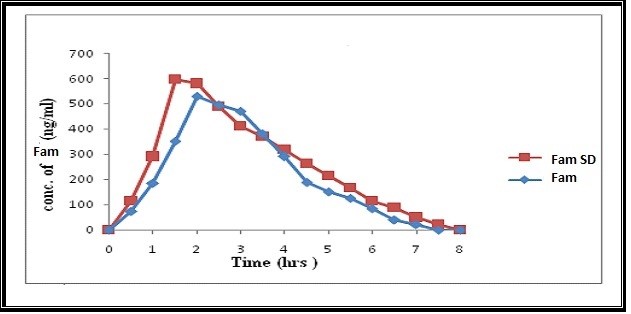
Figure 6: Plasma concentration v/s time profile of FAM and solid dispersion FAM
CONCLUSION
The developed method possess good selectivity, specificity, there was no interference found in the plasma blanks at retention times of AMP and IS. We found a good correlation between the peak area and concentration of the drug under prescribed conditions. The method has been successfully applied to preclinical pharmacokinetic studies of Famotidine in Rabbits.
CONFLICT OF INTERESTS
The authors report no conflict of interest
REFERENCES
- WL Chiou, S. Riegelman, Prep. And Dissol. Charact. Of several fast release solid disp. Of griseofulvin, j. pharm. Sci. 1969: 58:1505-1510
- WL Chiou, S. Niazio, Phase diagram and dissol. Rate studies on sulphathiazole-urea solid dispersion, j. pharm. Sci. 2006; 60:1333-1338
- Chiou, S. Riegelman, pharmaceutical application of solid disp. System, j. pharm. Sci. 1970; 1281-1302
- Kamal, MV. Ramana, dissolution enhancement of aceclofenac through solid dispersion, the ind. Pharmacist, 2002;6:70-72
- Dallob, CJ. Hawkey, characterization of etoricoxib, a novl selective cox2 inh., j. clin. Pharm., 2003; 4: 573-585
- Dresman, improving drug solubility for oral deli. Using sol. Disp. Eur. J. pharm. Bio. Pharm, 2000;50:47-60
- Khan, the concept of dissol. Effic. , j. pharm. Col., 1975; 27: 48-49
- liu, KG. Desai, charct. Of rofecoxib-peg 4000 solid disp. And tablets based on solid diso. Pharm. Dev. Tech. 2005; 10: 467-477
- Bogusz M, Krüger K, Maier R, Erkwoh R, Tuchtenhagen F. Monitoring of olanzapine in serum by liquid chromatography–atmospheric pressure chemical ionization mass spectrometry. J Chromatogr B Biomed Sci Appl 1999; 732: 257-269.
- Catlow JT, Barton RD, Clements M, Gillespie TA, Goodwin M, Swanson SP. Analysis of olanzapine in human plasma utilizing reversed-phase highperformance liquid chromatography with electrochemical detection. J Chromatogr B Biomed Sci Appl 1995; 668: 85-90.
- Devika G, Sudhakar M. Simultaneous determination of eprosartan mesylate and hydrochlorothiazide in pharmaceutical dosage form by RP-HPLC. Pharm Anal Acta. 2011; 2: 1-8.
- Friedich, B. Fussnegger, dissol. Rate impro. Of poorly water soluble drugs obtain by adsorbing solu. Of drug in hydrophilic solv. Onto high surface carrier, eur. J. pharm. Biophar., 62:171-177.
- Kamila MM, Mondal N, Ghosh LK. Spectrophotometric determination of eprosartan mesylate in raw material and experimental tablet. Indian J Chem Technol. 2008; 15: 194-6.
- Mire D, Silfani TN, Pugsley MK. A review of the structural and functional features of Olmesartan medoxamil, an angiotensin receptor blocker. J Cardiovasc Pharmacol. 2005; 46, 585-93.
- Ram GA, Harish MN, Naik, YA, Keshavayya J, Reddy V. 2011. High performance liquid chromatography analysis for determination of eprosartan mesylate in bulk drug. J Chem Pharm Res. 2011; 3: 945-9.
- Raju, S. Gurrala devel. And valid. Of HPLC UV method for the estimation of eprosartan in hum. Plasma, int. j. pharm. Sci. 2011;3: 191-194
- Varshosaz, R. Talari, dissol. Enhan. Of gliclazide using insitu micron. By solvent change method, pow. Tech, 2008; 187: 222-230.
- Uncan, the mech. Of drug release from solid disp. In water solu. Poly., int. j. pharm., 2002; 231:131-144.[i]