pp. 23-34
Krishna Kumar Upadhayay1, Dr. Mohammad Irfan Ali1
1School of Applied Sciences
Suresh Gyan Vihar University, Jaipur, Rajasthan-302017
Crresponding Author E-Mail: irfanclinical.res@gmail.com
ABSTRACT
Cancer stem cells (CSCs) have been suggested as central precursor of tumor initiation, progression, recurrence, and therapeutic impedance. Thus, identifying stem cells like moities within cancers and understanding their properties is important for the development of efficacious anticancer therapies and diagnostics. Lysed cancer stem cells can be analyze at genome, transcriptome, and proteome level from a single biological sample can provide better understanding. In this review, we have summarized major techniques that can be useful for cancer stem cell expression profiling at genome level, transcriptome and proteome level. Cancer biomarker based genome analysis can provide cancer diagnosis, prognostic, pharmacodynamics. Microarray based transcriptome profiling can provide better understanding at RNA level and also post transcription modifications, that are responsible for cancer. Proteomics techniques include gel-free and gel-based methods. Gel free method include stable isotope labeling by amino acids in cell culture (SILAC), Isobaric tags for relative and absolute quantitation (iTRAQ) and isotope coded affinity tagging (ICAT) is upgraded and better technique for Chemical proteomic, a combination of isotope coded affinity tagging (ICAT) and mass spectrometry, have proposed as powerful tools for identifying drug targets and explaining complex latent mechanisms of drug action against CSCs. Extracted protein can be analyzed by liquid chromatography (LC) coupled to MS/MS. This detection method permits for high resolution separation, thereby precisely revealing differential protein expression profiles. Gel-based methods employ, Two-dimensional difference in gel electrophoresis (2D-DIGE) is a method in which protein samples labeled by different fluorescent dyes are mixed with identical concentrations. A comparison generated 2D-DIGE fluorescence images allows for quantification of each spot. Hence, 2D-DIGE can reduce gel-to-gel variation by allowing simultaneous separation and comparison of several samples on one gel. Molecularly targeted drug delivery by Immunoliposomes, in which molecular targeting of cancer cells via liposomes conjugated with antibody or other ligand.
Keywords: Cancer stem cell, Drug designing, Molecular targeting and Immunoliposome
Introduction:
The successful completion of the human genome project has led to a tremendous increase in our understanding of the molecular basis of diseases. However, a comprehensive understanding of the dynamic protein pathways involved in normal and disease states, and in response to medical treatment, is required if we are to effectively treat disease. The next major challenge toward this aim is to identify the constituents of the human proteome in order to understand the human genome. Of particular importance will be to decipher protein alterations between health and disease to enable the identification and prioritization of pharmaceutically relevant targets. Indeed, from a therapeutics perspective, the majority of drug targets are proteins. This report will help to understand, how a complete simultaneous analysis of Many tumors cell including brain breast colon, gastric, kidney, leukemia, lymphoma, lung, melanoma, ovary, prostate and small, round blue-cell expression at genome, transcriptome and proteome can be useful for accurate molecular targeting and drug deigning and therapeutic treatments using some advance molecular biology techniques and some instrumental technique. The DNA microarray technique is a powerful tool for analysis of early cancerous events and also can help to separate the cancer from a normal cell. It is well known that complementary single- stranded sequences of nucleic acids form double stranded hybrids. This property is the basis of the very powerful molecular biology tools such as Southern and Northern blots, in situ hybridization, and Polymerase Chain Reaction (PCR). In these, specific single-stranded DNA sequences are used to probe for its complementary sequence (DNA or RNA) forming hybrids. This same idea also is used in DNA microarray technologies. DNA biomarkers like VNTR (variable number of tandem repeats) and SSR (Short sequence repeat) can accurately help in identification of DNA sequence associated with cancer. If the tumor is appear due devoid of genes results an aggressive form of the cancer, it may persistant stable for a long periods, and the treatment for this radical surgical resection along with with subsequent radiotherapy followed by chemotherapy may be adopted (Kroll 2008). Proteome analyses aim to not only identify changes in protein expression, but also posttranslational modifications, protein- protein interactions, cellular and sub- cellular distribution, and temporal patterns of expression, polymorphisms, epigenetic alterations, and micro RNAs in a single experiment. The new approachis proteomics used as the tool of current choice for discovery research, latest innovations in proteomics now have the potential for proteomic profile to become a standard practice in the clinical laboratory. Now proteomics profiling can exploit as powerful diagnostic and therapeutic bio-markers, and can also predict treatment outcome in many types of cancer. The purpose behind this different level cellular expression analysis is to understand the molecular pathways and associated molecules with the cancer and their therapeutic perspective.Biomarkers in disease identification: Diagnostic biomarkers
DNA biomarkers
Current applications of three broad categories of biomarkers i.e. tumor and DNA biomarkers, and other types of biomarkers. Whole genome of a cell does not express in a relatively same manner, because of some epigenetic alteration or can be non- coding as well, genome contains some sequence of DNA that can be used as reference for some disease causing alterations in DNA. Traditional DNA biomarkers are based on variable number of tandem repeats and Short sequence repeat (SSR), Single nucleotide polymorphisms (SNPs), deletions, insertions, or other variation on the DNA sequence level are among this group. Due to the availability of high-throughput molecular biological facilities, SNPs are the generally used to detect type of DNA variation. Thus identification of new DNA biomarkers can improve our ability to diagnose and treat human disease. Cancer is a therapeutic condition that include the changes of DNA at the cellular level, and these modifications exploited as measurement of the tumor. Apart from DNA biomarkers discussed above, we generally use the term “DNA tumor biomarkers” to indicate biomarkers perticularly to cancerous tumors. Typically, only the presence or absence of a mutation in a gene is determined.
Protein biomarkers
Recent approaches of biomarker analysis has concentrated on identifying one marker of a particular disease. However there is now general agreement of the statistical argument that a panel of independent disease related proteins considered in an aggregate should be less prone to the influence of genetic and environmental ‘noise’ than is the level of a single marker protein and proteomics has the power to identify such panels of proteins in a high throughput manner. Each biomarker individually did not out- perform, however the combination of two of the new biomarkers together with significantly improved their performance. Thus identification of new protein biomarkers should substantially improve our ability to diagnose and treat human disease.
Example for current use of biomarkers:
Details of the examples discussed here are shown in Table-1 along with egeneral biomarkers, particularly, DNA biomarkers and DNA tumor biomarkers, which is in current use.Table-1 Biomarkers, DNA biomarkers and DNA tumor biomarkers
| Name | Type | Range of application | Commercial use | Indication | Time of measure | Outcome | Reference |
| BluePri ®
nt |
DNA
tumor |
Predictive | Yes | Breast cancer |
Known diagnosis, after surgery |
Reaction of individual therapies |
Krijgsman et al. (2012) |
| EGFR | DNA
tumor |
Predictive | PCO | Advanced non-‐small-‐ cell lung cancer | Known diagnosis, before first-‐ line therapy | EGFR TKI or
chemotherapy |
Keedy et al. (2011) |
| IL28B | DNA | Predictive | – | Hepatitis C virus 1 (HCV-‐1) | Known diagnosis, before treatment | Response to treatment with pegylated interferon (Peg-‐ IFN) combined with ribavirin (RBV) | Holmes et al. (2011) |
| K-‐RAS | DNA
tumor |
Prognostic | PCO | Advanced colorectal cancer | Known diagnosis, before chemotherapy | Treatment with cetuximab yes or no | Karapetis et al. (2008) |
| MammaPrint® | DNA
tumor |
Prognostic | Yes |
Breast cancer |
Known diagnosis, after operation |
Precise stage of tumor, aggressivity of tumor |
Buyse et al. (2011) |
DNA Microarrays for Disease Profiling
Major refinements of the technology underlying DNA libraries, PCR, and hybridization have come together in the development of DNA microarrays (sometimes called DNA chips), which allow the rapid and simultaneous screening of many thousands of genes. Among the many benefits of the Human Genome Project are new and powerful tools such as the genome-wide hybridization devices referred to as microarrays that were Initially designed to measure gene transcriptional levels, microarray technologies are now used for comparing other genome features among individuals and their tissues and cells. Results provide valuable information on disease subcategories, disease prognosis, and treatment outcome.
We now can measure the majority of mRNAs, proteins, metabolites, protein- protein interactions, genomic mutations, polymorphisms, epigenetic alterations, and micro RNAs in a single experiment. The data generated by these methods together with the knowledge derived by their analyses was unimaginable just a few years ago. More recent uses of DNA microarrays in biomedical research are not limited to gene expression. DNA microarrays are being used to detect single nucleotide polymorphisms (SNPs) of our genome (Hap Map project), aberrations in methylation patterns, alterations in gene copy number, alternative RNA splicing, and pathogen detection These techniques, however, produce such amounts of data that making sense of them is a difficult task. So far, DNA microarray technologies are perhaps the most successful and mature methodologies for high-throughput and large-scale genomic analyses.
A microarray can answer such questions as which genes are expressed at a given stage in the development of an organism. The total complement of mRNA is isolated from cells at two different stages of development and converted to cDNA, using reverse transcriptase and fluorescently labeled deo4mucleotides. The fluorescent cDNAs are then mixed and used as probes, each hybridizing to complementary sequences on the microarray, for example, the labeled nucleotides used to make the cDNA for each sample fluoresce in two different colors. The cDNA from the two samples is mixed and used to probe the microarray. Spots that fluoresce green represent mRNAs more abundant at the single-cell stage; those that fluoresce red represent sequences more abundant later in development. The mRNAs that are equally abundant at both stages of development fluoresce yellow. By using a mixture of two samples to measure relative rather than absolute abundance of sequences, the method corrects for variations in the amounts of DNA originally deposited in each spot on the grid and other possible inconsistencies among spots in the microarray. The spots that fluoresce provide a snapshot of all the genes are being expressed in the cells at the moment they were harvested-gene expression examined on a genome-wide scale.
The medical applications of microarrays already have an important role in cancer treatment. There are many different types of human cancer, and tumors-even within a particular tissue-can vary greatly in their growth rate, tendency to metastasize, and response to various therapies. It is often impossible to differentiate tumor types based solely on appearance. However, the cells making up a tumor exhibit characteristic patterns of gene expression, called a transcriptional profile, which often differ greatly from one tumor to the next. These can provide a kind of tumor fingerprint. Recent progress in the diagnosis and treatment of breast cancer provides a vivid example. Broad clinical studies over the past decade have used microarrays to develop transcriptional profiles of many thousands of breast cancers. Treatment protocols have been tracked, and successes and failures carefully documented. Particular genes and groups of genes are gradually being identified that, when expressed at higher levels, and in certain combinations, serve as prognostic predictors. The result is a growing database of correlations that allows the use of transcriptional profiles to develop prognoses and select the most beneficial therapies. These tools are becoming widespread in oncology clinics, and their value to oncologists and patients will only increase with time and experience. Some post-ranscription modification, that are responsible for causing disease and cancers can be identify by that has been fought over extensively. Various techniques have been described like Eastern blotting, which is involve by using different types of probes to detect post-translational modifications of proteins, for example the use of lectins to probe a protein- blotted membrane in search eastern blotting, for specific carbohydrates.
Two-Dimensional Gel Electrophoresis
Two-dimensional gel electrophoresis allows the separation and display of up to 1,000 different proteins on a single gel, that separate proteins according to charge in the first dimension prior to separation of proteins according to size in the second dimension. Mass spectrometry can then be used to partially sequence individual protein spots and assign each to a gene. The appearance and disappearance of particular protein spots in samples from different tissues, from similar tissues at different stages of development, or from tissues treated in ways that simulate a variety of biological conditions can help define cellular function. Because many proteins are displayed at once in these gels, the technique is also applicable to systems biology. For example, a bacterial pathogen may evolve so as to become resistant to one or more antibiotics. The pattern of protein expression in that bacterial strain is likely to change, and multiple proteins may be affected. Although 2D-GE is a powerful technique, one of its limitations is that 2D gels remain relatively low throughput. Recent advantage of Two- dimensional gel electrophoresis is introduced by coupling 2D- GE with the mass spectroscopy and analysis of two 2D-GE sample simultaneously for more accurate resolution and comparison termed as Two-dimensional fluorescence difference gel electrophoresis (2D DIGE). Two-dimensional difference gel electrophoresis and require large amounts of starting material (~50µg) with low sensitivity for detection of low abundance proteins such as cytokines and signaling molecules. In addition, certain basic proteins, and very high- or very low- molecular weight proteins are not separated well by 2D-GE. Protein samples to be compared by 2D DIGE are covalently labelled with different dyes either by Cy3 or Cy5 fluorescent dyes, then analyses by using tandem mass spectrometry, MS/MS and MALDI, these spectroscopies are capable for itself to cleave proteins into fragment with enzymatic proteases. Each protein will have a unique peptide mass fingerprint (PMF) based on its amino acid sequence, and hence the peptide masses determined by the mass spectrometer can identify the protein from the thousands of proteins in the database. Protein samples compared are covalently labelled with either one of Cy5 or Cy3 fluorescent dyes. An internal control, to be run on every single gel in the experiment, is labelled with Cy2. All three samples are combined and separated on the one 2D-gel, thus eradication gel-to-gel variation. The single gel is scanned at three different wavelengths to generate an image specific for each CyDyeTM fluore
The DeCyderTM software (Amersham Biosciences, GE Healthcare) compares the test samples to the internal control, and then overlays the two test samples to identify changes in expression levels of individual protein patches. 3- dimensional view of compared proteins is generated to make ensure correct detection of protein patches. As all gels are running with the same internal standard, multiple gels from various experiments can all be compared with statistical confidence. Importantly, mass spectrometers can be automated and can achieve sensitivity down to the femtomole level and require large amounts of starting material (~50µg) with low sensitivity for detection of low abundance proteins such as cytokines and signaling molecules. In addition, certain basic proteins, and very high- or very low- molecular weight proteins are not separated well by 2D-GE. Protein samples to be compared by 2D DIGE are covalently labelled with different dyes either by Cy3 or Cy5 fluorescent dyes, then analyses by using tandem mass spectrometry, MS/MS and MALDI, these spectroscopies are capable for itself to cleave proteins into fragment with enzymatic proteases. The “minimal” dyes react at pH 8.5 to specifically label the epsilon amino group of lysine residues. The ratio of dye to protein is kept very low (typically 50g of protein to 400 pmoles of dye) to make sure that the only proteins visualized are those labeled with a single dye molecule. This approach referred to as “minimal labeling”, ensures that the pattern seen on a 2-D gel is the same as that seen for a post staining technique. In this way the de novo sequence of peptides can be determined, which together with the peptide mass fingerprint can be used to positively identify the protein. Importantly, the development of specialized software algorithms that rapidly search MS data against known or predicted proteins within databases makes this process enable to high throughput analysis. Following separation of protein extracts on a standard two- dimensional polyacrylamide gel (2-D gel), a fluorescence scanner, for example the TyphoonTM 9000 series scanner, is used to scan the gels. The scanner has the ability to spectrally distinguish between the three CyDye Fluors, through the use of a combination of several lasers and filters. This enables the different samples on the same gel to be visualized individually.
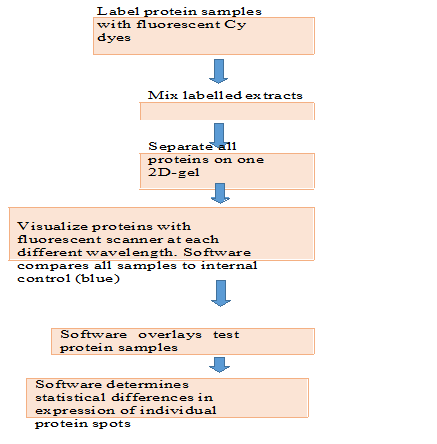
Figure.1. Two-dimensional fluorescence difference gel electrophoresis (2D-DIGE) workflow
Other Perspectives
Medical research is mainly responsible for greatly benefit from the increasing use of proteomics, with the potential to develop better diagnostic and prognostic tests, to identify power of new therapeutic targets and to move towards individualized patient therapy. Proteomics has the power to greatly enhance our understanding of the molecular basis of disease and to identify novel drug targets. In addition to proteomics has also proved for biomarker discovery, In future further research work have room for enhance and performance and reproducibility of established proteomics tools before they can be routinely used in therapeutics and diagnostics. There are some issues regarding pre and post analytical variables for detection of analytical variability ultimately biological variation must be handled. The efforts of number of researchers starting to discuss and address many of these facing issues, therefore the future have extremely bright for the widely use of proteomics. As current standard proteomics technologies require skilled operators and expensive equipment, their use in routine clinical laboratories is not yet feasible. In cancer stem cell several transduction pathway, that Regulate self- renewal pathway in normal stem cell, while in CSCs these pathways of signaling are normally deregulated due to accumulated mutations and epigenetic changes. Conventional cancer therapies normally target aberrant pathways in the rapid proliferating bulk tumor cell, but often spare the CSCs leading to tumor recurrence and metastasis. Therefore, the designing of new therapies must be based on targeting the signaling pathway that affects both CSCc as well as bulk tumor cell. One challenge here is understanding the signaling pathways through which CSCs regulate their self- renewal and maintenance and hence tumor growth and metastasis, so we can use that as a target to abrogate CSCs. Another challenge is the combination of drugs targeting different pathways for better treatment outcomes. The combinations of conventional cancer therapies together with specific CSC targeted therapies bring the promise of extremely low possibility of cancer recurrence.
Conclusion
Differential analysis of CSCs sample versus normal stem cell can give more accurate and clear resulting data of profiled biological expressed sample (CSCs). The data taken using combination of these techniques can be further utilized for drug deigning and pharmacodynamics. The combinations of conventional cancer therapies together with specific CSC targeted therapies bring the promise of extremely low possibility of cancer recurrence. Individualized patient treatments determined by ‘point of care’ biomarker profile testing can be major breakthrough. New insights into the pathogenesis of disease, identification of novel therapeutic targets and development of routine clinical tests for bio marker panels such as Protein microarrays; multiplexed ELISA’s.
Acknowledgments
The authors are sincerely thankful to Dr. Gaurav Sharma Principal School of Applied Sciences, Suresh GyanVihar University for providing a guidence for writing a review article.
References
- Anderson L. Candidate-based proteomics in the search for biomarkers of cardiovascular disease. J Physiol 2005;563:23-60.
- Rai A J, Zhang Z, Rosenzweig J, et a Proteomic approaches to tumor marker discovery. Arch Pathol Lab Med 2002;126:1518- 26.
- Zhang Z, Bast RC Jr, Yu Y, et a Three biomarkers identified from serum proteomic analysis for the detection of early stage ovarian cancer. Cancer Res 2004;64:5882- 90.
- Weinstein JN, Myers TG, O’Connor PM, et a An information-intensive approach to the molecular pharmacology of cancer. Science 1997;275:343-9.
- Perou CM, Sorlie T, Eisen MB, et a Molecular portraits of human breast tumours. Nature 2000;406:747-52.
- Sorlie T, Perou CM, Tibshirani R, et a Gene expression patterns of breast carcinomas distinguish tumor subclasses with clinical implications. Proc Natl Acad Sci U S A 2001;98:10869-74.
- Cobleigh MA, Vogel CL, Tripathy D, et a Multinational study of the efficacy and safety of humanized antiHER2 monoclonal antibody in women who have HER2- overexpressing metastatic breast cancer that has progressed after chemotherapy for metastatic disease. J Clin Oncol 1999;17:2639-48.
- Vogel CL, Cobleigh MA, Tripathy D, et a Efficacy and safety of trastuzumab as a single agent in first-line treatment of HER2- overexpressing metastatic breast cancer. J Clin Oncol 2002;20:719-26.
- Slamon DJ, Leyland-Jones B, Shak S, et a Use of chemotherapy plus a monoclonal antibody against HER2 for metastatic breast cancer that overexpresses HER2. N Engl J Med 2001;344:783-92.
- Esteva FJ, Valero V, Booser D, et a Phase II study of weekly docetaxel and trastuzumab for patients with HER-2- overexpressing metastatic breast cancer. J Clin Oncol 2002;20:1800-8.
- Van’t Veer LJ, Dai H, van de Vijver MJ, et a Gene expression profiling predicts clinical outcome of breast cancer. Nature 2002;415:530- 6.
- van de Vijver MJ, He YD, van’t Veer LJ, et a A gene expression signature as a predictor of survival in breast cancer. N Engl J Med 2002;347:1999-2009.
- Ross ME, Zhou X, Song G, et a Classification of pediatric acute lymphoblastic leukemia by gene expression profiling. Blood 2003;102:2951-9.
- Yeoh EJ, Ross ME, Shurtleff SA, et a Classification, subtype discovery, and prediction of outcome in pediatric acute lymphoblastic leukemia by gene expression profiling. Cancer Cell 2002;1:133-43.
- Haslinger C, Schweifer N, Stilgenbauer S, et a Microarray gene expression profiling of B- cell chronic lymphocytic leukemia subgroups defined by genomic aberrations and VH mutation status. J Clin Oncol 2004;22:3937-49.
- Baker SG, Kramer BS, McIntosh M, Patterson BH, Shyr Y, Skates S (2006) Evaluating markers for the early detection of cancer: overview of study designs and methods. Clin Trials 3(1):43–56
- Biomarkers Definitions Working Group (2001) Biomarkers and surrogate endpoints: preferred definitions and conceptual framework. Clin Pharmacol Ther 69(3):89–doi:10.1067/mcp.2001. 113989
- Bock C (2009) Epigenetic biomarker developmen Epigenomics 1(1):99–110. doi:10.2217/epi.09.6
- Bossuyt PM, Reitsma JB, Bruns DE, Gatsonis CA, Glasziou PP, Irwig LM, Lijmer JG, Moher D, Rennie D, de Vet HC (2004) Towards complete and accurate reporting of studies of diagnostic accuracy: the STARD initiative. Fam Pract 21(1):4–10
- Buchner AM, Blonski W, Lichtenstein GR (2011) Update on the management of Crohn’s disease. Curr Gastroenterol Rep 13(5):465–474. doi:10.1007/s11894-011- 0220-x
- Buyse M, Michiels S, Sargent DJ, Grothey A, Matheson A, de Gramont A (2011) Integrating biomarkers in clinical trials. Expert Rev Mol Diagn 11(2):171–182. doi:10.1586/erm.10.120
- Cottone M, Orlando A, Renna S (2010) Investigational agents for Crohn’s disease. Expert Opin Investig Drugs 19(10):1147– doi:10.1517/13543784.2010.510513
- Egerer K, Feist E, Burmester GR (2009) The serological diagnosis of rheumatoid arthritis: antibodies to citrullinated antigens. Dtsch Arztebl Int 106(10):159–163. doi:10.3238/arzteb2009.0159
- El Rouby S, Mestres CA, LaDuca FM, Zucker ML (2004) Racial and ethnic differences in warfarin response. J Heart Valve Dis 13(1):15–21
- European Medicines Agency (1998b) ICH Topic E8: general considerations for clinical http://www.ema.europa.eu/docs/en_GB/ document_library/Scientific_guideline/2009/ 09/WC500002877. pdf. Last accessed Feb 13, 2012
- European Medicines Agency (2009) Guideline on clinical evaluation of diagnostic http://www.ema.europa.eu/docs/en_GB/ document_library/Scientific_guideline/2009/ 09/WC500003580. pdf. Last accessed Feb 17, 2012
- van’t Veer LJ et a (2002) Gene expression profiling predicts clinical outcome of breast cancer. Nature. 415:530– 6.
- Singh D et a (2002) Gene expression correlates of clinical prostate cancer behavior. Cancer Cell. 1:203–9.
- Wang T et a (2000) Identification of genes differentially over-expressed in lung squamous cell carcinoma using combination of cDNA subtraction and microarray analysis. Oncogene. 19: 1519–28.
- Alon U et a (1999) Broad patterns of gene expression revealed by clustering analysis of tumor and normal colon tissues probed by oligonucleotide arrays. Proc. Natl Acad. Sci. U. S. A. 96: 6745–50.
- Ramaswamy S et a (2001) Multiclass cancer diagnosis using tumor gene expression signatures. Proc. Natl Acad. Sci. U. S. A. 98:15149–54.
- Brachat A, Pierrat B, Brungger A, Heim J. (2000) Comparative microarray analysis of gene expression during apoptosis-induction by growth factor deprivation or protein kinase C inhibition. O 19:5073–82.
- Bonner AE, Lemon WJ, You M. (2003) Gene expression signatures identify novel regulatory pathways during murine lung development: implications for lung tumorigenesis. J. Med. Gen. 40:408–17.
- Brachat A et a (2002) A microarray- based, integrated approach to identify novel regulators of cancer drug response and apoptosis. Oncogene. 21:8361–71.
- Rhodes DR et a (2004) Large-scale meta- analysis of cancer microarray data identifies common transcriptional profiles of neoplastic transformation and progression. Proc. Natl Acad. Sci. U. S. A. 101:9309–14.
- Cutler DJ et a (2001) High-throughput variation detection and genotyping using microarrays. Genome Res. 11:1913-1925.
- Yan PS et a (2001) Dissecting complex epigenetic alterations in breast cancer using CpG island microarrays. Cancer Res. 61: 8375–80.
- Pollack JR, Perou CM, Alizadeh AA, et a (1999) Genome-wide analysis of DNA copy- number changes using cDNA microarrays. Nat. Genet. 23:41–6.
- Relogio A et a (2005) Alternative splicing microarrays reveal functional expression of neuronspecific regulators in Hodgkin lymphoma cells. J. Biol. Chem. 280: 4779–84.
- Wang D et a (2002) Microarray-based detection and genotyping of viral pathogens. Proc. Natl Acad. Sci. U. S. A. 99:15687–92.
- Conejero-Goldberg C et al. (2005) Infectious pathogen detection arrays: viral detection in cell lines and postmortem brain tissue. B 39:741–51.
- MacDonald, T.J., Brown, K.M., LaFleur, B. et a (2001), ‘Expression profiling of medulloblastoma: PDGFRA and the RAS/MAPK pathway as therapeutic targets for metastatic disease’, Nat. Genet. Vol. 29, pp. 143–152.
- Pomeroy, S.L., Tamayo, P., Gaasenbeek, M. et a (2002), ‘Prediction of central nervous system embryonal tumour outcome based on gene expression’, Nature Vol. 415, pp. 436–442.
- Perou, C.M., Sorlie, T., Eisen, M.B. et a (2000), ‘Molecular portraits of human breast tumours’, Nature Vol. 406, pp. 747–752.
- Sorlie, T., Perou, C.M., Tibshirani, R. et a (2001), ‘Gene expression patterns of breast carcinomas distinguish tumor subclasses with clinical implications’, Proc. Natl. Acad. Sci. USA Vol. 98, pp. 10869– 10874.
- Sorlie, T., Tibshirani, R., Parker, J. et a (2003), ‘Repeated observation of breast tumor subtypes in independent gene expression data sets’, Proc. Natl. Acad. Sci. USA Vol. 100, pp. 8418–8423.
- van’t Veer, L.J., Dai, H., van de Vijver, M.J. et a (2002), ‘Gene expression profiling predicts clinical outcome of breast cancer’, Nature Vol. 415, pp. 530–536.
- van de Vijver, M.J., He, Y.D., van’t Veer, L.J. et al. (2002), ‘A geneexpression signature as a predictor of survival in breast cancer’, N. Engl. J. Med. Vol. 347, pp. 1999– 2009.
- West, M., Blanchette, C., Dressman, H. et a (2001), ‘Predicting the clinical status of human breast cancer by using gene expression profiles’, Proc. Natl. Acad. Sci. USA Vol. 98, pp. 11462– 11467.
- Knight, J. (2002), ‘Minimum standards set out for gene-expression data’, Nature Vo 415, pp. 946.
- Schubert, C.M. (2003), ‘Microarray to be used as routine clinical screen’, Na Med. Vol. 9, pp. 9.
- Branca, M. (2003), ‘Genetics and medicine. Putting gene arrays to the test’, Science Vo 300,
- pp. 238 Pollack, J.R., Perou, C.M., Alizadeh, A.A. et a (1999), ‘Genome-wide analysis of DNA copy-number changes using cDNA microarrays’, Nat. Genet. Vol. 23, pp. 41–46.
- Xiao Z, Adam BL, Cazares LH, et a Quantitation of serum prostate-specific membrane antigen by a novel protein biochip immunoassay discriminates benign from malignant prostate disease. Cancer Res 2001;61:602933.
- Petricoin EF, Ardekani AM, Hitt BA, et a Use of proteomic patterns in serum to identify ovarian cancer. Lancet 2002;359:572-7.
- Villanueva J, Shaffer DR, Philip J, et a Differential exoprotease activities confer tumor- specific serum peptidome patterns. J Clin Invest 2006;116:271-84.
- Weinberger SR, Dalmasso EA, Fung ET. Current achievements using ProteinChip Array technology. Curr Opin Chem Biol 2002;6:86-91.
- Phizicky E, Bastiaens PI, Zhu H, Snyder M, Fields S. Protein analysis on a proteomic scale. Nature 2003;422:208-15.
- Liotta LA, Espina V, Mehta AI, et a Protein microarrays: meeting analytical challenges for clinical applications. Cancer Cell 2003;3:317-25.