pp. 70-77
Suresh Kumar Agrawal1*, Janeswer Verma1 and Devendra Singh Rathore2
1Research Scholar, Department of Pharmaceutical Sciences, Suresh Gyan Vihar University, Jaipur- 302025, Rajasthan, India
2Principal, L. R. Institute of pharmacy, Solan (HP)
*Corresponding Author email: suresh_pharma2006@yahoo.co.in
ABSTRACT:
An analytical method for the quantification of residual solvents in Glibenclamide was estab-lished using a static headspace gas chromatography (HSGC) coupled with a flame ionization detector (FID). Methanol, acetone and ethylene dichloride as residual solvents determined in Glbenclamide. Analysis was performed by headspace GC/FID method on Shimadzu 2014 system with auto sampler HT 200H. Nitrogen was used as carrier gas with constant flow rate of 4.2 mL/min and the separation of residual solvents were achieved on DB-624 column. The thermostat temperature was 100 °C for 30 minute for each vial and after the equilibration the vials were pressurized and injected on GC column. The %RSD for six injections obtained in acceptance criteria. The percentage recovery ranges obtained from 92.49 and 106.69%.The correlation coefficient R2 obtained greater than 0.99. The method parameters were validated included specificity, limit of detection and quantification, accuracy, linearity, precision, and robustness. A new, simple, specific, accurate and precise method was validated according to the International Conference on Harmonization (ICH) guidelines.
Ker words: Glibenclamide, Validation, GC/FID, Residual Solvents, ICH
INTRODUCTION:
Residual solvents, or organic volatile impurities, are a potential toxic risk of pharmaceutical products and have been a concern of manufacturers for many years [1]. Moreover, residual solvents can also affect the quality and stability of not only drug substances but also drug products [2, 3]. Thus, acceptable levels of many are included in regulatory guidance documents; in particular in guideline Q3C issued by the International Conference on Harmonization of technical requirements for registration of pharmaceuticals for human use (ICH) [4].
The Gas Chromatography is capable of establishing both the identity and concentration of eluting components in the carrier gas stream and responds to range of compounds with a common physical or chemical characteristic. Residual solvents are not desirable substances in the final pharmaceutical product so their acceptable limits have been published in pharmacopoeias and ICH guidelines. In the present work, a simple and sensitive gas chromatographic method has been developed for the determination of residual solvents in Glibenclamide [5, 6].
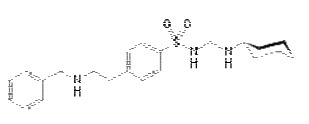
Figure-1: Structure of Glibenclamide IUPAC Name: 5-chloro-N-(4-[N- (cyclohexylcarbamoyl) sulfamoyl]phenethyl)-2-methoxybenzamide Glibenclamide is an anti-diabetic drug in a class of medications known as sulfonylureas, closely related to sulfa drugs. It is sold in doses of 1.25 mg, 2.5 mg and 5 mg. It is used in the treatment of type II diabetes. As of 2007 [update], it is one of only two oral anti-diabetics in the World Health Organization Model List of Essential Medicines (the other being metformin). It is also sold in combination with metformin [7, 8]. The aim of this study is to develop HS-GC method for analysis of residual solvent in Glibenclamde. The residual solvents compared to standard solvents and the ICH standard residual solvents limit.
Tabel-1: Residual Solvents of Glibenclamide
|
Solvents |
Class of solvents
(As per ICH) |
Specification limit |
| Methanol
Acetone Dichloroethane (EDC) |
Class-2
Class-2 Class-1 |
3000 ppm
5000 ppm
5 ppm |
EXPERIMENT
The analysis was performed on Shimadzu Gas Chromatograph GC-2014 with Headspace Auto sampler HT 200H with flame ionization detector. The injection temperature was 190 oC and detector temperature was 290 oC. Column was DB- 624 m (30 m long, 0.53 mm internal Diameter coated with 3.0 um film of 6 % Cyanopropylphenyl 94 % Dimethyl polysiloxane). Split ratio of injection 1: 4, Oven temperature was maintain at 40ºC for 5 min ,and then raised at rate of 10ºC/min to 170 ºC ,maintain for 7 min. Total run time was 25 min. Nitrogen was used as a carrier gas at a constant flow rate of 4.2 mL/ min [9-14].
Factor affecting and optimization:
- Selection of solvent (Diluent): Four diluents had been tried- Water, DMSO, DMF and NMP. Unknown peak observed in sample so DMF was avoided as a dilue DMSO and NMP were avoided due to recovery of EDC was not under limit of ICH guidelines and finally water is selected as a diluent which was compitable with sample.
- Selection of column: Three columns had been checked for the development namely BP-01, BP-5 and DB- BP-01 and BP-5 were avoided due to poor peak separation, DB-624 was finalized and it showed good system suitability parameters.
- Selection of Ramping Rate: Increasing the ramping rate caused the retention time to decrease. Three Ramping rate were tried at 5 ºC/min, 10 ºC/min, 15 ºC/min. At 5 ºC/min the retention time was very high, so it was not selected. Poor sepration was observed at 15 ºC/min then finally 10 ºC/min was optimized.
- Flow Rate: As the flow rate increase, the viscosity of carrier gas decrease and velocity increase. Five flow rates were applied 3 ml / min, 5 ml / min, 4 ml / min, 4.2ml/min, 4.5 ml / min and 5 ml/ min. 4.2 ml / min was selected as a finalized flow rate.
- Linear Velocity: Linear velocity is the mobile phase velocity through the column which can be calculated from the length of the column divided by the retention time. Increased the linear velocity which caused decrease the retention time. Velocity was tried at, 20 cm/sec to 35 cm/sec and finally 32 cm/sec is optimize
f) Optimization of head space condition:
Due to problem in recovery and precision of EDC increased the equilibrium time and temperature for complete evaporation of EDC solvent and after this change, better precision and recovery results observed.
Finalized chromatographic condition: Table-2: Instrument conditions
|
Table-3: Head space conditions
| Equilibration Temperature | 100o C |
| Equilibration Time | 50 min. |
| Transfer line Temperature | 115o C |
| Vial Volume | 20 mL |
| Syringe Rinsing | Thrice |
| Injection Volume | 1 mL by Head space |
| Syringe Filling Speed | 25 mL/min |
| Injection Speed | 15 mL/min |
| GC Cycle Time | 35 min |
Reagents: Methanol, Acetone, Ethylene dichloride (EDC) and water were used as analytical grade reagents. Glibenclamide bulk drug sample was obtained from Shree danvantary pharmaceutical analysis and research center, Surat.
Preparation of standard solution:Mixture of requisite concentration for solvents were obtained by mixing appropriate aliquots of stock in dissolving solvent with respected to sample concentration. For Glibenclamid, the working concentration of solvents in the solution is as 3000 µ g/L for Methanol, 5000 µg/L for acetone and 5 µg/L for EDC prepared in water diluent.
Diluent: Water
Preparation of Blank solution: For the Blank solution, pipette out 5 mL respective diluents into a HS vial and the vial were closed with PTFE silicon septa closure and secured the closure with an aluminium cap.
Preparation of standard solution: Standard Stock Solution-I: Accurately weighed and transferred 0.020 gm 1, 2 Dichloroethane (EDC) in to 200 ml Volumetric flask containing 140 ml Water and make up the volume to the mark with diluent.
Standard Solution-II: Accurately weighed and transferred 0.300 gm of methanol, 0.500 mg of acetone in to a 100 ml volumetric flask containing approximately 50 to 60 ml of Water and make up volume to the mark with diluent.
Working standard solution: Then further dilute 40 ml of Standard Solution-II to 200 ml volumetric flask containing approximately 50 to 60 ml of Water. Add 1 ml of Standard stock solution-I in this solution and make up the volume to the mark with dluent
Test solution: Weight accurately about 1000 mg of the substance under examination, dissolve and dilute to 5 ml with diluents into a HS vial and seal the vial immediately with PTFE septa.
VALIDATION:
The validation was done by evaluating specificity, limit of detection and quantitation, linearity, accuracy, repeatability, and precision of residual solvents as was indicated in the International Conference on harmonization (ICH) guidelines Q2B “validation of analytical procedures: methodology.
Specificity: Specificity denoted to resolving power of system. Resolution of the analyte peak from the nearest peak is not less than The specificity of the analytical method was determined by injecting blank solution and the individual and Mix solution of residual solvents under the same experimental conditions and find out parameters like resolution, theoretical plates, tailing factor.
Detection Limit (LOD) and Quantification Limit (LOQ): A series of solutions were prepared by quantitative dilutions of the stock solution of solvents. Each solution was injected into the chromatograph in triplicate and the mean peak area was calculated. A graph of mean peak area against concentration in µg/L was plotted and the equation of regression line and the residual standard deviation was determined. LOD and LOQ determined by statistical formula.
LOD= 3.3 SD/Slope LOQ= 10
SD/Slope
Where, SD is standard deviation
RESULT AND DISCUSSION:
The result for the residual solvents in the sample (in µg/L) using the following formula. Where, A is peak area response of solvent in test preparation, B is peak area response of solvent interference from blank preparation, C is peak area response of solvent in standard preparation, D is peak area response of solvent interference from blank preparation, Ws is weight of component in standard in gm, Wt is weight of sample taken in gram, E is dilution factor.
( A −B )/( C − D ) × W s/ W t× E × 10 6
Specificity:
There was no interference of dissolving solvent at the retention time of methanol, acetone and EDC and all peaks were well re- solved from each other. Hence the method was found specific.
Specificity parameters showed in table-4.
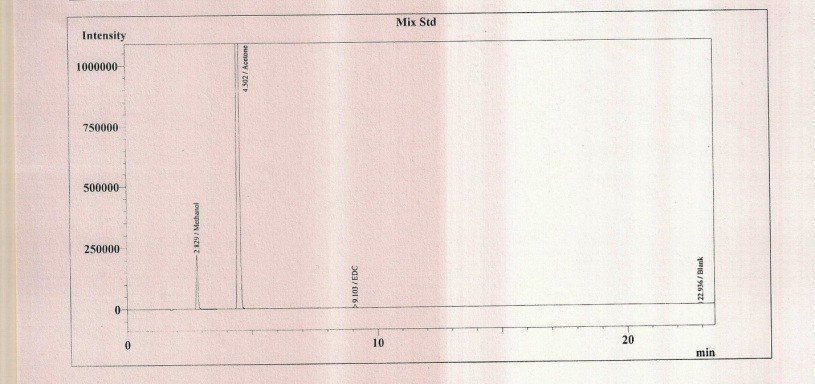
Figure 2: Graph of standard solution (Methanol, Acetone, and EDC)
Table-4: Specificity Parameters
|
Tabel-6: Linearity of residual solvents of Glibenclamide
|
||||||||||||||||||||||||||||||||||||||||||||||||||||||||||||||||||||||||||||||||||||||||
Precision: Six replicate injections of standard solution for system precision were analyzed as per the proposed method and the chromatograms obtained. The standard deviation and percentage relative standard deviation (% RSD) was calculated. For the precision of method and system the % RSD for six solvents complies with acceptance criteria of less than 2%, hence the method and system is said to be précised.
Table-5: Precision Parametres:
|
||||||||||||||||||||||||||||||||||||||||||||||||||||||||||||||||||||||
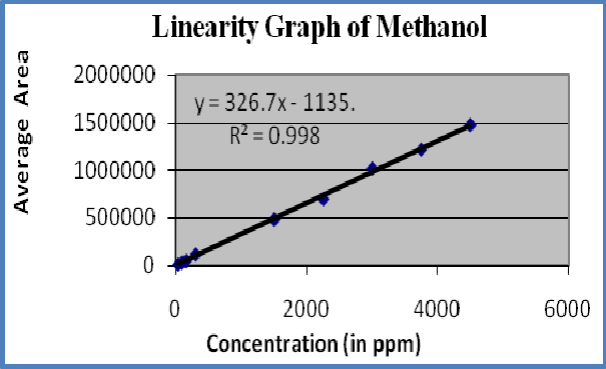
Figure-3: Linearity graph of Methanol
Linearity : A linear relationship evaluated across the range of concentration of analyte solvents (1% to 150% Concentration) and calculate the correlation coefficient, y- intercept and slope of the regression line. The acceptance criteria of correlation coefficient should be more then 0.99. Linearity of solvents showed in table-6 and figures 3-5
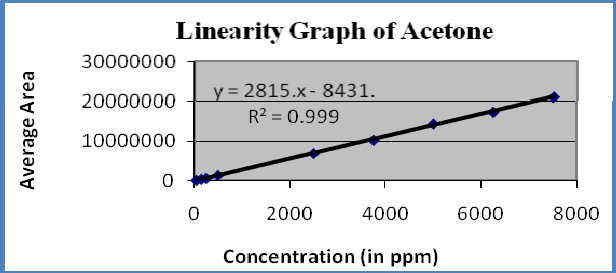
Figure-4: Linearity graph of Acetone
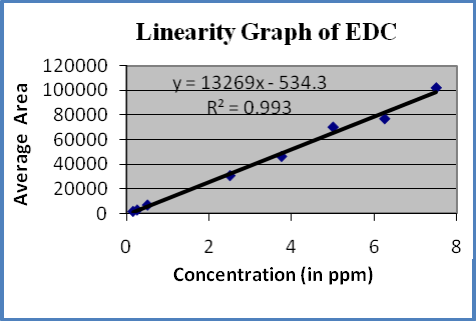
Figure-5: Linearity graph of EDC
LOD & LOQ (Limit of Detection & Limit of Quantification)
The LOD and LOQ were calculated by instrumental method. LOD is determined as the lowest amount to detect and LOQ is the lowest amount to quantify by the detector. The value for the limit of detection and limit of quantification showed in table No-5.
Tabel-7: Limit of detection and Limit of quantification
|
||||||||||||||||||||||||||||||
Accuracy / % Recovery (By Standard Addition Method)
Accuracy of the method was ascertained by standard addition method at 3 levels. Standard solution quantity equivalent to 50 %, 100% and 150 % were added in Sample. The amount recovered by the method was compared to the amount added. Percent deviation was calculated at each levels and a grand average across all the levels was also calculated. The acceptances criteria of recovery at each level are 90.0 – 110.0%. [15] % Recovery = (Area of solvent in spiked sample-Area of solvent in Sample)*100/Area of solvent in standard % Recovery calculated showed in table-8
Tabel-8: Accuracy / % Recovery
| Solvents | Range (%, µg/L) | Recovery1 | Recovery 2 | Recovery 3 | % RSD |
| Methanol | 1500 µg/L (50 %) | 103.6 | 101.53 | 100.78 | 2.75 |
| 3000 µg/L (100%) | 100.19 | 99.36 | 101.12 | 1.47 | |
| 4500 µg/L (150%) | 98.11 | 98.74 | 99.87 | 0.643 | |
| Acetone | 2500 µg/L (50 %) | 96.69 | 93.47 | 96.98 | 1.82 |
| 5000 µg/L (100%) | 99.47 | 92.49 | 98.18 | 0.54 | |
| 7500 µg/L (150%) | 96.18 | 93.20 | 97.41 | 0.62 | |
| EDC | 2.5 µg/L (50 %) | 103.3 | 97.35 | 96.58 | 3.84 |
| 5 µg/L (100%) | 104.34 | 99.03 | 98.34 | 3.04 | |
| 7.5 µg/L (150%) | 97.12 | 103.24 | 106.69 | 5.37 |
Robustness:
There was no significant difference in the results for Methanol, Acetone, EDC obtained by the normal method and those obtained by carrying out deliberate changes in the method. Hence the method was found robust with respect to change in the flow rate for the carrier gas and incubation temperature in head space. It should show the reliability of an analysis with respect to deliberate variations in method parameters.
Ruggedness:
The ruggedness was established by determining residual solvents using the same chromatographic system and the same column by two analysts on a different day. The assay result indicated that the method was capable with high precision. Additionally, good separations were achieved, which suggested that the method was selective for all components under the test.
CONCLUSION:
The method developed for the analysis of residual solvents in Glibenclamide, is rapid, sensitive, accurate and rugged. The method is quite faster with a run time of 25 minutes and achieves to address the residual solvents at the prescribed range of limits. The method exhibits a good range of quantization.
ACKNOWLEDGEMENT
The authors wish to thanks the management of Shree Danventary pharmaceutical analysis and research center, kim, Surat, Gujrat (India) providing me Samples and research facilities, Thanks to management of Suresh Gyan Vihar University to providing necessary facility and to all my research colleagues for their support in the work.
REFERENCES:
- Singare, P. U., Lokhande, R. S. & Jadhav, P. V. (2012). Development and Validation of Headspace Method for Determination of Residual Solvents in Diphenoxylate Hydrochloride Bulk Drug American Journal of Chemistry, 2(2), 1- DOI: 10.5923/j.chemistry.20120202.01
- Grodowska, K. and Parczewski, A. (2010). Analytical methods for residual solvents determination in pharmaceutical products. Acta Poloniae Pharmaceutica and Drug Research, 67(1), 13-26.
- Reddy, P. B. & Reddy, S. (2009). Residual Solvents Determination by HS-GC with Flame Ionization Detector in Omeprazole Pharmaceutical formulations. International Journal of PharmTech Research, 1 (2), 230-234.
- Puranik, S.B., Sanjay, P.N. & Rao, G.K. (2009). Determination of Organic Volatile Impurities in Herbal Formulations and Extracts by Capillary Gas Chromatography. International Journal of Applied Research in Natural Products, 2(1), 32-46.
- Elzbieta, U.S, Groman, A., Kaczmarek, L. S. & Golebiewsk, P. (2007). GC method for quantitative determination of residual 2-(2- chloroethoxy) ethanol (CEE) and N- methyl-2-pyrrolidinone (NMP) in quetiapine. Acta Poloniae Pharmaceutica Drug Research, 64(2), 187-
- Pandey, S., Pandey, P., Kumar, R. & Singh, N.P. (2011). Residual solvent determination by head space gas chromatography with flame ionization detector in omeprazole API. Brazilian Journal of Pharmaceutical Sciences, 47(2), 123-128.
- Yusai, I., Kyoko, I., Wakana, S. and Tada, A. (2012). Analysis of Residual Solvents in Annatto Extracts Using a Static Headspace Gas Chromatography Me American Journal of Analytical Chemistry, 2012, 3, 638-645.
- Kim, H., Kim, D., Yang, J. S. & Kim, C. W. (2006). Sample Preparation for Headspace GC Analysis of Residual Solvents in Hyaluronic Acid Derivative Fiber. Bull. Korean Chem. Soc, 27(2), 302- 305.
- Koji, U., Saito, Y., Yasuhiro, F., Chuichi, W. & Kazuichi, U., et (2000). Determination of Residual Solvents in Bulk Pharmaceuticals by Thermal Desorption/Gas Chromatography/Mass Spectrometry. Chem. Pharm. Bull, 48(12), 1894-1897.
- Ramos, C. S. (2013). Development and validation of a headspace gas chromatographic method for determination of residual solvents in five drug substance International Journal of Pharmaceutical Science Invention, 2(3), 36-41.
- Jahnavi, N., & Saravanan, V. S. (2012). Method development and validation for the determination of residual solvents in Methocarbamol pure drug by HS-GC. I J. Research Pharma. Che, 2(2), 456- 467.
- Singh, P. & Sinha, , Determination of Residual Solvents in Bulk Drug and Formulations. Am.J. PharmTech Res, 3(4), 289-
- Rele, R. V. & Mali, R. N. (2012). Determination of Residual Solvents in Citalopram Hydrobromide by Gas Chromatography. Am. J. PharmTech Res. 2(4), 619-625.
- Farajzadeh, A., Goushjuii, L., Djozan, D. & Mohammadi, J.K. (2012). Dispersive liquid-liquid microextraction combined with gas chromatography for extraction and determination of class-1 residual Solvents in pharmaceuticals. J. Sep Sci., 35(8), 1027-1035.
- Katarzyna, G. & Parczewski, A. (2010). Analytical methods for residual solvents determination in pharmaceutical produc Polish Pharmaceutical Society Drug Research, 67, 13-26.