Research article
Vol. 7 Issue 1 Page No. 26-33
Rupali Shrivastava1, Meenakshi Meena2 and Hariom Nagar2*
1* Department of Chemistry, Vivekananda Global University, Jaipur, India
2 Department of Chemistry, Suresh Gyan Vihar University, Jaipur, India
Abstract
In this research paper Cu(II) complex of Azo dye Arsenazo(III) was synthesised with dye molecule acting as ligand and copper ion acting as central metal. All analytical and kinetic studies of the complex were carried out at absorbance maximum 610 nm of the complex. Optimisation of complexation conditions was done and on the basis of study of change in temperature and pH, 40 0C and pH 3.0 were selected. Results obtained in Mole ratio method and Jobs method of continuous variance corresponded to stability constant (K) value as 5.48 and 5.44 respectively with 1:1 ratio of metal:ligand in the complex. Other kinetic parameters like molar absorptivity coeff. of complex e = 2.7 X 10³ l mol−1 cm−1 with Beer’s law range 1.306 X10²mg/ml to 9.792 X 10²mg/ml, coefficient of variance 1.250 and relative standard deviation % is ±1.21%. were also calculated from the calibration curve data.
Keywords:
Arsenazo
Copper Spectrophotometric Stability constant
*Corresponding author’s e-mail addresses: hariom.nagar@mygyanvihar.com, hariomnagariitr@gmail.com
Received: 25 Aug 2020; Accepted: 28 Dec 2020; Published: 25 Jan 2021
- Introduction
Use of spectroscopic technique for the determination of contents of azo dye mixtures is not at all simple due to the spectral interferences caused by overlapped absorption bands. Arsenazo, an important commercial dye is a pseudo octahedral Co(II) complex which contains 1-nitroso-2-naphthol-6-sulfonate (NNSH) in the deprotonated state (NNS-) as a bidentate ligand (Ali et al. 2020; ; Chung 2016; Jauberty et al. 2016; Liang and He 2016).
Stability constants are most used method by chemist to determine the properties of metal-ligand reactions in water and biological systems (Manobala et al. 2019; Bhardwaj et al. 2017; Niazi et al. 2007; Jauberty et al. 2013; Mossalamy 2009). The extent of formation or tendency to get transformed, of a particular species is indicated by its thermodynamic stability. Whereas the speed of the kinetic stability of a species refers to the speed with which transformations leading to the attainment of equilibrium will occur.
The purity of Arsenazo-III dye in commercial market is approximately 50% and also it is unstable in acidic solution, hence green colour of dye get disappeared (Serenjeh et al. 2016; Golmohammadi et al. 2012; Lu et al. 2004; Hogendoorn et al. 2018) in acidic medium. The wavelength of maximum absorption of commercial Arsenazo-III in aqueous solution is 540 nm.
- Experimental
2.1. Instrumentation
For UV-Visible spectral study , Elico model no SL-159 double beam spectrophotometer was used in Department of Chemistry, Vivekananda Global University Jaipur
Elicomodle no 111E (glass electrode) pH meter was used or observation of pH.
Metaler Toledo model no AB 204-S electrical balance was used for accurate measurement of amount of metal.
2.2. Reagents
Preparation of Arsenazo-III solution- Arsenazo-III with graded purity was purchased from LOBO Chemie. Standard solution of Arsenazo-III was prepared by dissolving accurately weighed 0.776 g using 100 ml double distilled water. The resulting solutions were filtered through whatman filter paper no.42 to avoid impurities.
Preparation of metal solutions-A standard solution of copper nitrate pentahydrate containing 1mg of metal per ml was prepared by accurately weighing and dissolving metal compounds in acidic solutions. The solutions was standardized by standard methods. Solutions of required strengths were obtained from standard stock solutions by suitable dilution.
- Preliminary Studies
To determine the nature of complex formed, different sets with variable proportion of metal, Cu(II), with Arsenazo(III) were prepared as per details mentioned in table 1. Absorbance of each set was measured in the wavelength range 500-650nm using UV-Visible spectrophotometer and obtained results are summarized graphically in figure 1 for Cu(II): Arsenazo (III) complex . Maximum absorbance wavelength λmax for Cu(II): Arsenazo (III) complex is 610nm as is clearly visible in figure 1.
Table 1: Composition of mixtures
| Mixture | Final Concentration =2.0 X 10⁻⁵ | Ratio M:L | ||
| Metal solution(in ml) | Arsenazo-III solution (in ml) | Metal ion: Arsenazo(III) | ||
| A | 0.00 | 4.00 | 0:1.0 | |
| B | 8.00 | 4.00 | 1:0.5 | |
| C | 4.00 | 4.00 | 1:1.0 | |
| D | 2.00 | 4.00 | 1:2.0 | |
| E | 1.33 | 4.00 | 1:3.0 | |
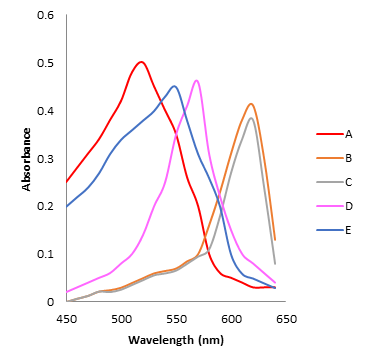
Figure 1: UV-Visible absorbance spectrum of Copper(II): Arsenazo III complex at various compositions
From figure 1 it is evident that the region of maximum absorbance of Arsenazo III is at wavelength 540 nm and there is a sharp shift of the curves due to complex formation whereby λmax shifts to 580 nm., which is considered to be the region of the maximum absorbance of the complex. In curve B and C this is true but in curve D and E where Arsenazo III is in excess , the wavelength of maximum absorbance of the chelate shifts that of the Arsenazo III alone. These results indicate that only one complex having λmax 580 nm is formed under the condition of study.
- Calibration Data and Validation
Calibration data for Arsenazo(III) was measured by preparing set of solutions with variable concentration of Arsenazo(III) keeping concentration of metal, Cu(II) ,constant and following the standard procedure.
Calibration data summarized in table 2 for arsenazo(III) copper complex shows good agreement in the concentration range 1.306 X10²mg/ml to 9.792 X 10²mg/ml of Arsenazo(III) with molar absorptive coefficient of complex as 2.7 X 10³ l mol−1 cm−1 with coefficient of variance 1.250 and relative standard deviation % is ±1.21%.
Table 2: Calibration data Arsenazo(III): Cu(II) Complex
| S.No. | Weight Taken Arsenazo(III)
(in µg) |
Average Weight found Arsenazo(III)
(in µg) |
C.V | %R.S.D |
| 1 | 1.306 X 10² | 1.208 X 10² | 0.750 | 0.979 |
| 2 | 1.632 X 10² | 1.534 X 10² | 0.600 | 0.972 |
| 3 | 1.926 X 10² | 1.926 X 10² | 1.067 | 0.326 |
| 4 | 2.285 X 10² | 2.285 X 10² | 0.000 | 0.000 |
| 5 | 2.611 X 10² | 2.578 X 10² | 1.250 | 0.642 |
| 6 | 2.938 X 10² | 2.938 X 10² | 0.000 | 0.000 |
| 7 | 3.264 X 10² | 3.264 X 10² | 0.000 | 0.000 |
| 8 | 3.590 X 10² | 3.656 X 10² | 1.081 | 0.653 |
| 9 | 3.917 X 10² | 3.949 X 10² | 0.833 | 0.236 |
| 10 | 4.243 X 10² | 4.243 X 10² | 0.000 | 0.000 |
| 11 | 4.570 X 10² | 4.537 X 10² | 0.714 | 0.326 |
| 12 | 4.896 X 10² | 4.896 X 10² | 0.000 | 0.000 |
| 13 | 5.222 X 10² | 5.222 X 10² | 0.000 | 0.000 |
| 14 | 5.549 X 10² | 5.5516 X 10² | 0.588 | 0.468 |
| 15 | 5.875 X 10² | 5.875 X 10² | 0.000 | 0.000 |
| 16 | 6.201 X 10² | 6.201 X 10² | 0.000 | 0.000 |
| 17 | 6.521 X 10² | 6.561 X 10² | 0.500 | 0.360 |
| 18 | 6.854 X 10² | 6.919 X 10² | 0.952 | 0.856 |
| 19 | 7.181 X 10² | 7.115 X 10² | 0.909 | 0.652 |
| 20 | 7.507 X 10² | 7.475 X 10² | 0.435 | 0.732 |
| 21 | 7.834 X 10² | 7.768 X 10² | 0.833 | 0.846 |
| 22 | 8.160 X 10² | 8.127 X 10² | 0.400 | 0.318 |
| 23 | 8.486 X 10² | 8.486 X 10² | 0.000 | 0.000 |
| 24 | 8.813 X 10² | 8.812 X 10² | 0.000 | 0.000 |
| 25 | 9.139 X 10² | 9.172 X 10² | 0.357 | 1.216 |
| 26 | 9.465 X 10² | 9.531 X 10² | 0.689 | 0.894 |
| 27 | 9.792 X 10² | 9.824 X 10² | 0.333 | 0.562 |
- Composition of Complex
The metal:ligand ratio in Cu(II) complexes of Arsenazo (III) was confirmed using spectral method, namely Mole ratio method and Continuous variance Job’s method . The concentration of both metal and dye was kept as 2.0 × 10⁻⁵ M
5.1. Mole Ratio Method
A series of solutions flasks are organized wherein the metal ion concentration , Cu2+ , was kept fixed and that of the ligand Arsenazo( III) was changed. Absorbance of each flask was recorded at absorbance maximum of Arsenazo-Cu(II) i.e 580 nm. Plot with absorbance on Y –axis and mole ratio of reagent at X-axis was then plotted as shown in figure 2 for Cu(II)-Arsenazo(III) complexes respectively. For the complexes, a curve with a positive slope is obtained till mole ratio value one after which there is no increase. This indicates that metal has been used up entirely at mole ratio one and further addition of ligand (Arsenazo (III) dye) produce no more complexation. Hence Cu(II):Arsenazo complex composition is 1:1 by mole ratio method.
For calculating the value of stability constant (K) we use :
K=(1-α) / α2C
here α gives the degree of dissociation and C is the concentration of the complex. For Cu(II)-Arsenazo(III) complex 5.48 value of log K is obtained as per mole ratio plot.
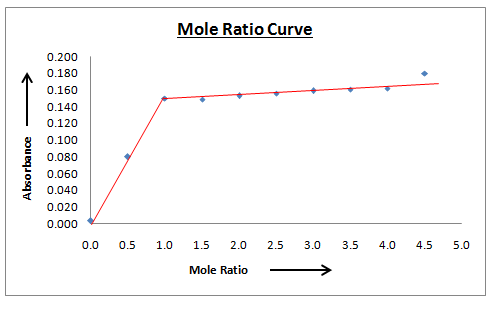
Figure 2: Mole ratio Plot of Cu(II): Arsenazo (III) complex
5.2. Job’s Method of Continuous Variance
A sequence of solutions were prepared with total volume of metal ion and Arsenazo(III) as constant 10 ml and variable proportions i.e., 0–10, 1–9, 2–8, 3–7 10–0. Thus solutions are mixed in such a method that concentration in totality (C) of Arsenazo(III) Cx and metal ion Cm is maintained persistent and merely their ratios are varied.
Cx + Cm = C
Absorbance of individual set of solution was evaluated at the absorbance maximum of complex. Plot of absorbance and mole fraction of ligand (Cx/C) was then plotted as shown in Figure 3 for the complexes. On extrapolation curve gives point of intersection (n). Configuration of Cu(II): Arsenazo(III) complexes is 1:1. Value of stability constant K as obtained from Job’s method of continuous variation plot was found to be 5.44 for Cu(II): Arsenazo(III) complex.
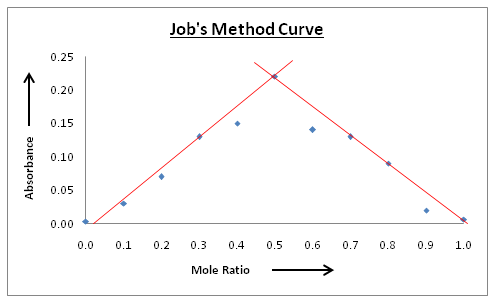
Figure 3: Job’s method Plot of Cu(II): Arsenazo(III)complex
- Effect of Temperature
The effect of change in temperature on the complexation of Copper (II) with Arsenazo(III) was examined by recording the absorbance with variation in temperature from 200C to 800C of an equimolar mixture of the metal and ligand. In case of Cu(II)-Arsenazo(III) complex the absorptivity remains constant when temperature of the aqueous solution was varied from 300C to 500C as is visible in plot figure 4. Beyond this range the absorptivity of the complex decreased as a result of decomposition of the complex. All observations were thus carried out at 400C (±50C).
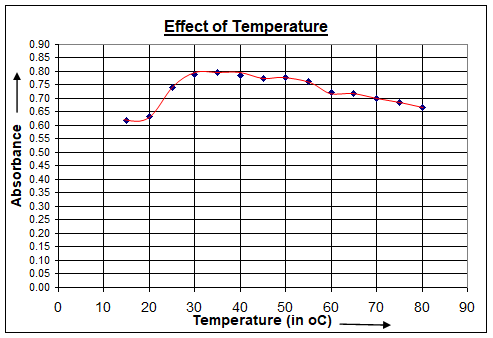
Figure 4 :Effect of change in temperature on Cu(II): Arsenazo(III)complex
- Effect of Change in pH
The influence of pH on complex was determined by recording the absorbance of complex at different pH at λmax of complex. It was found that the absorbance of Cu(II)-Arsenazo(III) complex at 610nm is the same between pH 2.0 to 4.5 .This indicates that the suitable pH range for the photometric determination of copper with Arsenazo III is 2.0 to 4.5 on this basis pH 3.0 were selected in this study.
- Conclusion
Calibration data show that molar absorptivity coeff. of Arsenazo(III):copper complex is e 2.7 X 10³ l mol−1 cm−1. Complex follow the Beer Lambert’s law in the range 1.306 X10²mg/ml to 9.792 X 10²mg/ml. The method can be used to determine Arsenazo(III) in various water samples. This method can be used for testing quality of effluent samples using Arsenazo(III) for dying .
References
Ali, M.Y., G.M. Hassan, A.M.S. Hassan, Z.A. Mohamed, and M.F. Ramadan. 2020. In vivo genotoxicity assessment of sunset yellow and sodium benzoate in female rats. Drug Chem. Toxicol. 43:504–513.
Bhardwaj N., and J. Kaushik. 2017. Spectrophotometric study of complexation of Labetalol with some transition metal ions. World J. Pharm. Pharm. Sci. 6: 1108–1111.
Chung, K.T. 2016. Azo dyes and human health: a review. J. Environ. Sci. Health C Environ. Carcinog. Ecotoxicol. Rev. 34: 233–261.
El-Mossalamy E. 2009. Potentiometric and spectroscopic studies of sulfonamideazo-dye complexes with some transition metal ions and uranium. Port. Electrochim. Acta 27:143–52
Golmohammadi H., A. Rashidi, and S.J. Safdari. 2012. Simple and rapid spectrophotometric method for determination of uranium (VI) in low grade uranium ores using arsenazo (III) Chem. Chem. Technol. 6: 245–249.
Hogendoorn C., P. Roszczenko-Jasińska, N.C. Martinez-Gomez, J. d. Graaff, P. Grassl, A. Pol, H.J.M. Op den Camp, and L. J. Daumannc. 2018. A facile Arsenazo III based assay for monitoring rare earth element depletion from cultivation media of methanotrophic and methylotrophicbacteria. J. Appl. Environ. Microbiol. 84: e02887-17.
Jauberty L., N. Drogat, J. Decossas, V . Delpech, V. Gloaguen. V . Sol. 2016. Optimization of the arsenazo-III method for the determination of uranium in water and plant samples. Talanta 115: 751–754.
Jauberty L., N. Drogat, J.L. Decossas. 2013. Optimization of the arsenazo-III method for the determination of uranium in water and plant samples. Talanta 115: 751– 4.
Lu Y.W., G. Laurent, and H. Pereira. 2004. A novel methodology for evaluation of formation constants of complexes: example of lanthanide–Arsenazo III complexes. Talanta 62: 959–70.
Manobala T., S.K. Shukla, and T.S. Rao. 2019. A modified Spectrometric Arsenao III method for estimation of uranium and its biochemical application, J.J. Biochem. 2: 005.
Niazi A., N. Ghasemi, M. Goodarzi, and A. Ebadi. 2007. Simultaneous spectrophotometric determination of uranium and thorium using arsenazo III by H-Point standard addition method and partial least squares regression. J. Chin. Chem. Soc. 54: 411–8.
Serenjeh F.N., P. Hashemi, A.R. Ghiasvand, F. Rasolzadeh. 2016. A new optical sensor for selective quantitation of uranium by the immobilization of arsenazo III on an agarose membrane. Anal. Methods 8: 4181–7.
Liang Y., and Y. He. 2016. ArsenazoIII-functionalized gold nanoparticles for photometric determination of uranyl ion. Microchim. Acta 183: 407–413.