pp.1-7
Sanjay Kumar Sinha1, Ritesh Kumar Srivastav2, Sunil Kumar3, Rashi Dubey4
1Reader & HoD. , Department of financial studies, Veer Bahadur Singh Purvanchal University, Jaunpur 2Assistant Professor & HoD, Sherwood College of Engineering Research & Technology, Barabanki 3Research Scholar, Suresh Gyan Vihar University, Jaipur
4Assistant Professor, Sherwood College of Engineering Research & Technology, Barabanki
*Corresponding Author email: skvermamc@rediffmail.com
ABSTRACT
Decisions with reference to capital involve managing relationships between a firm’s short assets and liabilities to make sure a firm is in a position to continue its operations, and have sufficient money flows to satisfy each maturing short debts and future operational expenses at lowest prices, increasing firm’s gain. The capitals noticeably go along with the operative cycle. A poring over of the operative cycle reveals that funds endowed within the operation area unit recycled back in to money. The shorter the amount of operative cycle the larger are going to be the turnover of the funds endowed in varied functions. The shorter amount of operative cycle shows higher potency of a firm. The potency of assets management are often determined by the in operation cycle of the firm. This paper aims at analyzing the potency of assets management through the connection between in operation cycle amount and profitableness of Cipla Ltd. To measure the capital Management potency, operative cycle has been calculated and therefore the relationship is formed with margin quantitative relation.
Key Words: Working Capital, Operating Cycle, Profitability, Operating Profit
INTRODUCTION
A social control accounting strategy specializing in maintaining economical levels of each parts of assets, current assets and current liabilities, in regard to one another. Assets management ensures a corporation has enough income so as to fulfil its short debt obligations and in operation expenses. An effective capital management system is a superb means for several firms to boost their earnings. The two main aspects of capital management square measure quantitative relation analysis and management of individual parts of capital. A few key performance magnitude relations of a capital management system are the capital ratio, inventory turnover, current magnitude relation, liquidity magnitude relation, money magnitude relation and therefore the assortment magnitude relation. Magnitude relation analysis can lead management to spot areas of focus like inventory management, money management, assets and due management.
II. CIPLA COMPANY LTD– AN OVERVIEW
In 1935, The Chemical, Industrial & Pharmaceutical Laboratories was started, that came to be popularly called Cipla. it had been formally opened on Gregorian calendar month twenty two,
1937 once the primary merchandise were prepared for the market. It’s crystal rectifier by Dr. Yusuf K. Hamied, Chairman and decision maker Cipla Ltd. The company offers varied medication and aid merchandise. It manufactures and sells varied unlisted merchandise, prescription merchandise, flavours and fragrances, pesticides, and animal merchandise. They’re offered within the type of tablets, capsules, injection, suspension, syrup, and pill disp. the corporate exports its merchandise to a hundred and eighty countries across the world. The company’s merchandise area unit certified by varied recognized regulative authorities specifically Food and Drug Administration (FDA), USA; Medicines and aid merchandise administrative unit (MHRA), GB so on. It operates producing facilities and R&D centres placed across Republic of India. The company is headquartered in Mumbai, Maharashtra, India.
III. REVIEW OF LITERATURE
Working capital is an important ingredient in the smooth running of business enterprises. It has not attracted much attention of scholars. Different authors have conducted research work to analyze working capital management in different ways. The purpose of review of literature is to know the present status of research in the said field. The findings of the prior research help in identifying the gaps’ and highlight the areas where further research can be undertaken. Therefore, the present chapter deals with the review of literature available in area of working capital management and its components.
Filbeck and Krueger (2005) studied on an analysis of working capital management results across industries over a period of five years starting from 1996 to 2000 by taking nearly 1000 firms as sample in the survey. In the study, two issues were addressed. One research question was “are firms with in a particular industry clustered together at consistent levels of working capital measures?” and the next was ‘does working capital management performance for firms with in a given industry change from year to year?’ In their study, classical analysis of variance was used to address the issue of industry rank differences with in years. Similarly, assessment of working capital management performance across year was conducted using the Kendall’s coefficient of concordance. After analyzing the data, they found significant difference existed between industries across time with respect to measures of working capital. The greatest differences occurred in the day sales outstanding ranking, which is statistically significant. In addition, regarding the consistency of working capital measures within industries through time, found that working capital measures for a given firm were not static and significant differences in the measures occurred across time. Finally, the result of the study suggested that there were significant differences in the industry working capital management rankings and working capital varied across time.
Nguyen (2005) investigated the hypothesis that cash balances have a precautionary motive and serve to mitigate the volatility of operating earnings, which they used as a proxy for risk. Their results showed that cash holdings are positively associated with firm level risk, but negatively related to industry risk. Consistent with past researches, cash holdings were found to be decreasing with the firm’s size and debt ratio and increasing with its profitability, growth prospects, and dividend pay-out ratio.
Teruel and Solano (2006) studied on effects of working capital management on small and medium sized -enterprises’ profitability of Spanish firms. For the purpose of study, data were collected from eight thousand eight hundred seventy two small and
medium sized enterprises covering the period 1996 to 2002. Use of the multiple regression analysis showed a significant negative relation of profitability with number of day accounts receivables, and number of day inventory. Further, the study pointed out that reducing the cash conversion cycle to a minimum as far as that was reasonable could increase the value of the firm. The result of the study was consistent with previous studies of Shin and Soenen,(1998) and Deloof, (2003)
Guney et al (2006) examined the impact of leverage on cash balances of firms. A negative relation between leverage and cash holdings exists to the extent that leverage of the firms acts as a proxy for their ability to issue debt. However, with the increase in leverage, firms may accumulate larger cash reserves so that the risk of financial distress and costly bankruptcy can be minimized. Therefore, at high levels of leverage, a positive relationship between cash holdings and leverage exists. Their results suggest a significant non-linear relationship between cash holding and leverage.
Drobetz and Gruninger (2006) investigated the determinants of Swiss no financial firms’ cash holdings over the 1995-2004. The results showed that the median of Swiss firms hold almost twice as much cash and cash equivalents as the median of UK or US firm. Moreover, they found a negative relationship between assets tangibility and cash holdings and a nonlinear relationship between leverage and cash holdings. Dividend payments were positively related to cash reserves. However, they could not prove a significantly positive relationship between growth opportunities and cash holdings.
Pandey (2009) examined cash management, inventory management, receivables management, working capital management of HINDALCO for the period 1989 to 2008. His findings suggested Company’s investment activities are not able to generate proper cash inflow. The time lag for converting raw materials to finished product has been increasing year after year in the study period. Company should make proper arrangement and policies to make all debts good and to reduce the average collection period. To conclude from the above review of studies, it is clear that factors affecting the level of working capital and its components have differing relationship across different countries and firms’ size. Moreover, the behaviour of these variables has been changing over time. The review of studies shows that no attempt has been made to analyze working capital management in NALCO. On the basis of previous studies, the current research tries to fill these gaps.
IV. OBJECTIVES OF THE STUDY
The main objective of the study is to look at the potency of capital in Cipla Ltd. the precise objectives of this study square measure as follows:
To analyse the efficiency of working capital management in the profitability of C
Analysis of liquidity position of the company.
To analyse the turnover of components of working capital of Cipla and its effect on profitability.
V. DATA & METHODOLOGY
In order to attain the objectives of study secondary data has been used. The data needed for this study has been extracted from annual reports of Cipla Ltd. Data stretches over a period of fifteen years starting from the year 2000 to 2014.The collected data has been organized within the form of tables so important inferences may well be drawn. The analysis is dispensed by creating use of varied monetary ratios, straightforward applied mathematics tools as well as graphs, correlation and multivariate analysis.
VI. WORKING CAPITAL EFFICIENCY ON PROFITABILITY
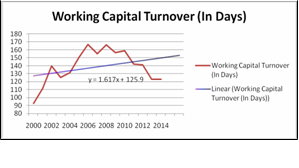
From Table 1, it is depicted that Working Capital Cycle Period has increased by 30.57 days during the study period from 92.45 days (Year-2000) to 123.02 days (Year-2014). Working Capital Cycle Period was moving between 92.45 days to 166.92 days throughout the study period. On an average Working Capital Cycle Period is 138.91 days and fluctuating throughout the study period.
Table 1: Efficiency of Working Capital Management
|
Year |
Working Capital Turnover (In
Days) |
ROTA (in %) |
| 2000 | 92.45 | 22.74 |
| 2001 | 111.14 | 19.93 |
| 2002 | 139.84 | 17.19 |
| 2003 | 125.37 | 17.26 |
| 2004 | 131.35 | 19.70 |
| 2005 | 150.37 | 20.49 |
| 2006 | 166.92 | 18.30 |
| 2007 | 155.19 | 14.60 |
| 2008 | 166.19 | 11.84 |
| 2009 | 156.74 | 15.54 |
| 2010 | 159.07 | 12.81 |
| 2011 | 142.15 | 14.75 |
| 2012 | 140.91 | 16.45 |
| 2013 | 123.02 | 12.74 |
| 2014 | 123.02 | 11.95 |
| Average | 138.91 | 16.42 |
Trend and Mean deviation of Working Capital Cycle Period are shown in Figure 1. Closest WCCP with the mean is in year 2002 at 139.84 days, in spite of that WCCP is much fluctuating throughout the study period.
Figure 1: Trend of WCCP
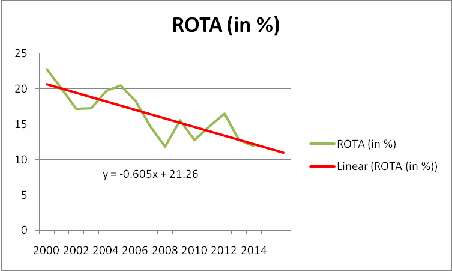
Trend of profitability (ROTA) is quite different to Working Capital Cycle Period and its movement is also in opposite direction in most of the years during study period. ROTA is moving around 16.42% during the study period. ROTA has shown a sustained profitability level in the company as it is closer to the mean of ROTA.
Figure 2: Trend of ROTA
Effect of Working Capital Efficiency on Profitability
To determine the relationship and effectiveness of
Working Capital Efficiency on Profitability, two variables have been taken, i.e. Profitability (ROTA) as Dependent Variables and Working Capital Cycle Period (WCCP) as Independent Variable. The equation to estimate effect of working capital efficiency on profitability is as under:
ROTA = α + β (WCCP) + ut
α = Exponential of the estimated value of intercept in
equation
β = Estimated value of coefficient in equation
ut = Error term
Table 2: Regression Analysis
LIQUIDITY POSITION OF CIPLA LT
Before analyzing the effectiveness of liquidity of company on profitability, liquidity of the company should be discussed first. The important liquidity ratios, viz. current ratio, liquid ratio and cash ratio have been used to examine the liquidity position of Cipla Ltd. The current ratio as appeared in table 3, has moved between 2.62 to 4.17. On an average current ratio of the company is 3.32: 1, which is higher than its standard of 2:1. This result shows that for every Rupee of current liability, there are current assets of Rs.3.32 available in the company. Liquid ratio of the company is always more than one except 2000, as its standard is 1: 1; company always maintains the average availability of liquid assets of Rs1.61 as against current liabilities of Rs1.00. On the basis of CR and LR, liquidity position of Cipla Ltd. is satisfactory. But when we see the cash ratio it is found that company has maintained low cash balance. On an average only Re.0.07 is available as compared to current liabilities of Re.1.00. Return on Total Assets has reduced during the study period from 22.7% to 12%.
Table 3: Liquidity Position and Profitability of Cipla Ltd.
| Coefficie
nts |
P–
value |
|
| Intercept | 26.203 | 0.000 |
| Working Capital Turnover
(In Days) |
-0.070 |
0.097 |
| R Square | 0.198 | |
| Correlation | -0.445 | |
| Standard Error | 3.131 | |
|
Table 2 shows the regression and correlation result
through which effects of working capital efficiency on profitability has been analyzed. The correlation between WCCP & GP is negative at moderate level of 0.445. Value of regression coefficient shows that one unit change in WCCP reduces profitability by just 0.07 units, which shows insignificant result at 5% level but it’s significant at 10% level. The independent variable explains only 20% (approx.) variation.
IX. EFFECT OF LIQUIDITY ON PROFITABILITY
In the judgment of liquidity position and its impact
on profitability, ROTA (Return on Total Assets) ratio has been taken as Dependent Variables and CR (Current Ratio), LR (Liquid Ratio) and C-R (Cash Ratio) are taken as independent variables.
The equation to estimate effect of liquidity on profitability is as under:
GPR=α + β1 (CR) + β2 (LR) + β3 (C-R) + ut
α = Exponential of the estimated value of intercept inequation
β1, β2 and β3= Estimated value of coefficient inequation
ut = Error term
|
Table 4: Correlation
Table 4 depicts the coefficient of correlation between ROTA and all independent variables. All independent variables are negatively correlated with profitability ratio. The correlation between ROTA and CR is moderate degree of negative correlation at 0.543, ROTA and LR is moderate degree of negative at
0.548 and ROTA & C-R is low degree of positive correlation at 0.051.
Table 5: Regression Analysis
Table 5 shows the regression results showing effects of liquidity of Cipla Ltd. on profitability. The result shows insignificant effect of liquidity on profitability at 5% significance level except Cash Ratio. One unit change in current ratio decreases profitability by
0.024 units, which is statistically not significant. For a unit increase in liquid ratio liquid ratio, profitability decreases by 0.057 units. One unit increase in cash ratio increases profitability by 0.449 units, which is statistically significant.. The independent variables explain 63 percent variation in the profitability.
X.TURNOVER OF WORKING CAPITAL COMPONENTS AND PROFITABILITY
Table 6 shows the turnover of working capital component and profitability of Cipla Ltd. Turnover of Inventory (ITR) and Receivables turnover ratio (RTR) are fluctuated during the study period. The average inventory ratio of the company is 2.25 times and Receivables turnover ratio is 4.12 times. Cash turnover ratio (CTR) has fluctuated between 1.625 times to 2.507 times. Operating profit ratio (OPR) is fluctuating around 0.17 times and become 0.242 times in 2012 from 0.22 times of 2008.
|
Table 6: Turnover of Working Capital Components and Profitability of Cipla Ltd.
|
Coefficients |
P-value |
|
|
Intercept |
0.306 |
0.000 |
|
CR |
-0.024 |
0.340 |
|
LR |
-0.057 |
0.115 |
|
C-R |
0.449 |
0.011 |
|
R Square |
0.630 |
|
|
Adjusted R Square |
0.529 |
|
|
Standard Error |
0.023 |
|
| 2012 | 2.35 | 4.82 | 2.118 | 0.242 |
| 2013 | 2.62 | 5.31 | 2.400 | 0.192 |
| 2014 | 2.62 | 5.31 | 2.400 | 0.180 |
| Average | 2.25 | 4.12 | 1.98 | 0.20 |
|
|||||||||||||||||||
EFFECT OF TURNOVER OF WORKING CAPITAL COMPONENTS ON PROFITABILITY
The effect of turnover of working capital component
on profitability of Cipla Ltd. is shown in table 7 and table 8. To determine the impact on profitability Operating Profit Ratio (OPR) is taken as Dependent Variables and; Inventory Turnover Ratio (ITR), Receivables Turnover Ratio (RTR) and Cash Turnover Ratio (CTR) are used as Independent Variable.
The equation to estimate effect of liquidity on profitability is as under:
GPR=α + β1 (ITR) + β2 (RTR) + β3 (CTR) + ut
α = Exponential of the estimated value of intercept in
equationβ1, β2 and β3= Estimated value of coefficient inequation
ut = Error term
|
Table 7: Correlation
The coefficient of correlation between turnover ratios of component of working capital and profitability was shown in table 7. The coefficient of correlation between Inventory Turnover Ratio and Operating Profit Ratio is low degree of negative correlation at
0.136. Receivables turnover ratio and operating profit ratio is positively correlated at 0.135 of low level. Similarly, cash turnover ratio is also positively correlated at low level of 0.050.
|
Table 8: Regression Analysis
On the basis of regression analysis shown in Table 8, no independent variable is significant at 5% level. One unit change in ITR and RTR change profitability by just -0.052 and -0.005 units respectively in negative direction. One unit change in CTR changes profitability by 0.052 in positive direction. The independent variables explain only 8 percent variations in profitability. The regression result is not satisfactory.
XII. CONCLUSION
Working capital management of Cipla is not effective as it fails in increasing profitability. Working capital cycle period is much fluctuating. Though, Liquidity position is good but surplus amount is involved to finance working capital. Company ignores the motives of holding cash. Turnover ratios are not much effective. The overall correlation and regression results are not satisfactory, which shows that working capital management of Cipla Ltd. is not effective to increase its level of profitability at different basis. It is hence suggested to Cipla Ltd. to control the length of the operating cycle so that company can increase its working capital efficiency. Company should ignore the excess finance in current assets so that their efficiency can be increased. Company should focus on proper management of its liquidity to increase the profitability.
REFERENCES:
Agarwal, K.,‘Management of Working Capital’, Sterling Publication Pvt. Ltd., New Delhi, 1993.
Agarwal, P. ‘Statistical Methods: Concepts, Application and Computation’, Sterling Publication Pvt. Ltd., New Delhi, 1996.
Filbeck, Greg and Krueger Thomas , “An Analysis of Working Capital Management Results Across Industries”, Mid-American Journal of Business, vo1.20, No.2, pp 11-28 (2006)
Nguyen “How Sensitive are Japanese Firms to Earning Risk? Evidence from Cash Holdings”, Electronic Library, SSRN,(2005)
Teruel, Pedro Juanand Solano, Pedro Martinez, “Effects of Working Capital Management on SME Profitability”, Working Paper, SSRN, Electronic Library, (2006)6.
Guney, , Ozkan, A. and Ozkan, N., “International Evidence on the Non-linear Impact of Leverage on Corporate Cash Holdings”, Journal of Multinational Financial Management,(2006)7.
Drobetz, W. and Gruninger , “Corporate Cash Holdings: Evidence from. a Different Institutional Setting”, presented at9thSGFconference (2006)
Bragg, M., ‘Business Ratios and Formulas: A Comprehensive Guide’, John Wile & Son, Inc, 2007.
Chandra, P., ‘Financial Management: Theory and Practice’, Tata McGraw Hill Publication Co. Ltd., New Delhi, 1990.
Firth, M., ‘Management of Working Capital’ The Macmillan Press Ltd. 1976.
Fleming, C., ‘The Essence of Statistics for Business’ Prentice-Hall of India Pvt. Ltd., New Delhi, 1997.
Hompton, Jonh J., ‘Financial Decision Making: Concept Problems and Cases’, Prentice-Hall of India Pv Ltd. New Delhi, 1983.
Joshi, R. ‘Cash Management: Perspective, Principles, Practices’ New Age International (P) Limited, Publication New Delhi, 2005.
Joshi, VijaiPrakash, ‘Working Capital Management Under Inflation’, Anmol Publication Pv Ltd., New Delhi, 2006.
Pandey, Shishir, “Financial Management In Aluminium Industries In India (With Special Reference To Hindalco)”, Ph.D. Thesis, BHU, (2009)