1Sumit Srivastava, 2Pankaj Dadheech, 3Ravi Shankar Sharma
1Professor,Manipal University, Jaipur, Rajasthan, India,
2Swami Keshvanand Institute of Technology, Management & Gramothan, Jaipur, Rajasthan, India,
3JECRC University, Jaipur, Rajasthan, India, er.ravishankarsharma@gmail.com
Abstract: VANET is basically a vehicular ad hoc network that is defined in the IEEE 802.11p for better adaptability in the wireless environment that is for the communication between both vehicle to vehicle and vehicle to infrastructure. Mobility of node in VANET reflect the movement pattern of nodes on the road. Routing protocol in VANET needs to study design, address challenges in term of high mobility of nodes, random topology, and packet transmission. It is necessary to design routing protocol that will address all these problems. In this paper we have study the various routing protocol and find the challenge and design the new routing protocol which is suitable for secure and reliable transmission in VANET network.
Keyword:- VANET, MANET , Security, Authentication , V2I, I2V, V2V
I. INTRODUCTION
VANET (Vehicular Ad-Hoc Network), a special class of MANET (Mobile Ad Hoc Network), is established for facilitating communication among nearby vehicles and between vehicles to roadside access points, with the help of wireless devices which are attached to the vehicles. Development of VANETs has paved way for numerous applications pertaining to road safety and travel convenience. Certain properties of VANETs make them significantly different from MANETs like restriction of node movements in fixed lanes rather than random movements as in the case of MANETs, high node mobility and no energy saving constraints. In the recent past, as a part of our research work, a few modified mechanisms have been developed to enhance the throughput of MANETs. The current research focuses on VANET applications.
To evaluate the varied and potential VANET applications, the primary step would be to perform a simulation as it is impractical to test the applications with real vehicles on the roads. The special characteristics of VANETs as described above call for a new simulation approach as the simulation parameters used for evaluating MANETs do not give accurate results for VANETs. One possible approach is to generate mobility traces of vehicles by a traffic simulator, (network centric) like Sumo, and use it as an input for a network simulator, for example, the widely used NS2 for simulating the results. VANET applications can be broadly classified into two major categories: A) Safety Related Applications and B) Comfort (Commercial) Applications.
Mobile WiMAX is a burgeoning network technology with diverse applications, one of them being used for VANETs. The performance metrics such as Mean Throughput and Packet Loss Ratio for the operations of VANETs adopting 802.16e are computed through simulation techniques. The simulation model proposed is close to reality as we have generated mobility traces for both the cases using a traffic simulator (SUMO), and fed it into network simulator (NS2) based on their operations in a typical urban scenario for VANETs.
- PROPOSED ALGORITHUM
1. Vehicle Traffic Information
The three basic fundamental characteristics of vehicular traffic are:
- Flow (q), vehicles/hours
- Speed (u), km/h
- Density (d), vehicle/km.
The average approximate values of these mentioned quantities could be estimated by basic traffic congestion stream model can be approximately related by the basic traffic stream model:
u=q / d
The relationships in reality are more complex. Hence they are modeled using simulation packages. Vehicles running on the roads know their speed and with the help of radio range in that area, all the vehicles are provided with the local instruments which are smart enough to detect the vehicle traffic density. This is done by counting the total number of such vehicles on that route. Speed and direction too can also be predicted and estimated using this instrumented vehicles. And now all the vehicles can use this information to determine the group membership of all active forwarders. It should be noted here, that only an approximate estimation can be predicted here through such traffic flow.
There are several factors that together contribute to the potential errors that may occur in such vehicular nets. They may include:
- Devices may fail to provide differences between the vehicles travelling in opposing directions.
- Signalized intersections. Measurements might get change due to interrupted flow facilities.
- Reliability on observation for an individual vehicle.
However the basic and most important advantage of group membership is that there is no additional computation required in this case.
2.2 Message Head Pair
Due to continuous change in the locations of automobiles running on the road over certain period of time, all the vehicles could expect some approximate knowledge of the message head location. Hence there is a need to update the information about the vehicle on instant basis. In order to accomplish this task, a message header is maintained where in all the information like message head location, its specific generation time is continuously updated. Together these things are called as message head pair. And now it is this message head pair which is circulated from vehicle to vehicle. Every vehicle has its own message holder, which maintains all the records of all message head pair. In addition to this, all the concerning messages are also attached to these headed pairs.
This installed headed pairs are responsible for providing most appropriate knowledge about the traffic which will be faced on that route and the location of the other messages generated by other vehicles. On the basis of the message head pair, the recipient of the message will receive the message, “As per the device information, the message head of
the specified vehicle was at some particular location at that time”. There are two versions which may come across of the same message. This may be older and the newer message. The head pair of these messages would be: <li, ti> (newer message) and <lj, tj> (older message). This is the case if (1), li is near to its destination location than lj or li==lj, but tj<ti. Continuously updates are necessary. Therefore, the devices installed in the vehicles, keep on to update the information as per the headed pairs received by the devices of that vehicle. And with such mechanism, the obsolete data can be easily discarded through this data exchange. All the message holders are called message head candidates. These candidates are permitted to publish their time to time current locations as per the message head location, hence generating updated message headed pairs. All the non-message head candidates, learn from the received messages. They cannot generate their own messages. Efforts will be required to stop the inaccurate information which is published and disseminated. The holder of the message presumes that whenever a message head candidate is received it is real with some certainty. And now the rules are specified which are designed for the transition purposes between a message head candidate and non-message head candidate. For example the current time is tc, and the current location of the vehicle is lc. The message head pair is <l,t>. l is message head location and t is its generation time.
2.3 Data Exchange
In this algorithm, we generally use local broadcasting mechanism. By this, the multiple receivers are capable to receive same messages in one transmission. The exchange of the data is often triggered by:
- Incoming of new messages
- Data message with old or new versions
- Appearance of new updated neighbors
Network partitioning is avoided by the transmissions which take place by new neighbors. Messages are quickly propagated and updated message head location’s information is triggered by the transmission of reception of data packets or messages with old versions. These can help us to eliminate the obsolete information of the messages heads. There is a concept called as full protocol. As per this protocol, if the automobiles have the information about the locations of their neighbors, the respective transmissions are triggered by the new messages only, if the nodes or vehicles running on that road are nearer to the destination region. The basic functionality of Full protocol is recited and designed to catch all the available forwarding opportunity. However, this protocol is costly in terms of data message overhead so all the constraints are set on which section of the protocol, a node is permitted to execute at any moment. For these purposes, we design, some kind of transmission states for automobiles and during this time, vehicles and all the nodes will execute data exchange protocols.
The owner of the message (holder) can be in two different transmission states:
- Active state
- Passive state
When the message holder is in active state, it executes the full protocol in order to propagate the message. While when the message holder is in passive state, it only transmits the data message on hearing some other older message version. Now we assume both the cases of vehicles being in active and in passive state. If the vehicles are nearer to the message head location, then they undergo active transmission state. These transmissions are limited geographically and temporally. For example:
Installed message head pair of message holder: <l.t>
Current location of vehicle: lc
Current time: tc
The vehicle is said to be in active state if tc<t+T2. And the current location of vehicle (lc) lies within the range of L2 from l. Else the vehicle is in passive state. When the vehicle is in passive state it remains in sending the direction in trajectory path, till the message expires. If the vehicle is not in any of these states, the message will be automatically dropped. With the received vehicle traffic information, T2 and L2 can be estimated. Here T2 is temporally and L2 is geographically. These terms, L2 and T2 explain the group membership and other relevant information of the vehicles which are actively propagating the message information during forwarding phase.
The specification and description of L2 and T2 is actually a trade-off between the messages overhead and the performance of data delivery. Here we need to set T2=T1. This is done because the transmission with latency more than T1, cannot yield any new message head candidates, which are new pairs of message heads. We need to estimate L2. This is done by limiting the average number (Nv) of instrumented automobiles on a road segments of length L. This is behind the location of message head.
Nv: it is an indicator used for message popularity.
Nv = T1*q = Vthresh
Where, q=estimated vehicle flow traffic Vthresh= threshold value
T1= Vthresh / q Also , Nv= L* D= Vthresh This implies, L=Vthresh/ D
D= vehicle density.
L2=(1-tc-t/T2) *L
Tc=current time.
t= message head pair’s generation time.
With the passing of time, L2 becomes smaller. This gets equal to 0 and hence the delay becomes T2
II. IMPLEMENTATION
Simulation Parameters
Table 1: Network simulator parameters for topology 1
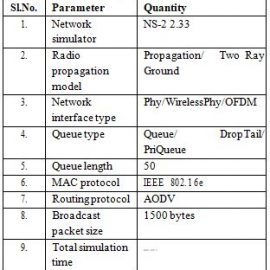
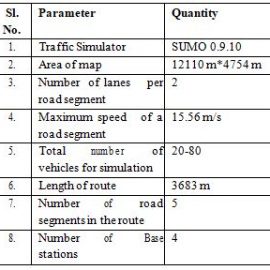
Table 2: Vehicular mobility model parameters for topology 1
2.1 Code to calculate the throughput
To calculate throughput the level of the received packet and the packet type are considered. An awk script is written to give us the details of the number of packets of each packet type received by any node in the network.
The formula to calculate the throughput is
![]()
2.2 Code to calculate the number of dropped packets
The networks are also analyzed on the parameter of the number of bits or packets dropped in the network. For a network to be efficient, the number of bits lost in collision or in the queue must be less. The code used to calculate the above is mentioned below.
III. RESULTS AND DISCUSSIONS
Graph 1: Bandwidth Vs Throughput (20 nodes)
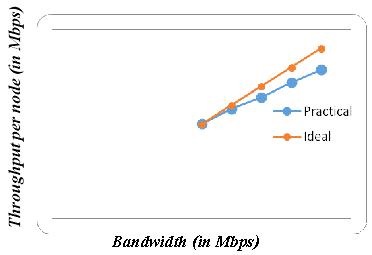
Fig. 1: Bandwidth Vs Throughput
It is observed that the throughput increases with the increase in the bandwidth. The expected throughput per node in ideal situations is the bandwidth assigned to the network, that is 25 to 45 Mbps in the increments of 5Mbps, in this case.
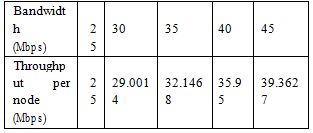
The observed values, for a fixed 20 nodes, are as follows.
Table 3: Bandwidth Vs Throughput (Topology 1)
Graph 2: Number of nodes Vs Throughput (40Mbps)
The observed values, for a varying number of nodes at a bandwidth of 40Mbps, are as follows.
Table 4: Number of nodes Vs Throughput(Topology 1)
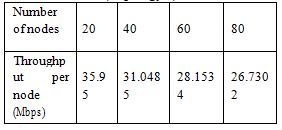
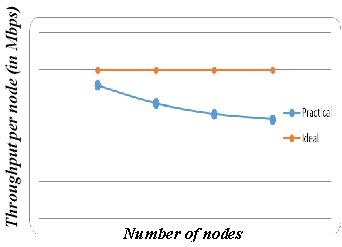
Fig. 2: Number of nodes Vs Throughput
When the bandwidth is kept constant at 40Mbps, ideal bandwidth for WiMAX networks, the throughput per node decreases as the number of nodes increases. The expected throughput is shown in red and is 40Mbps per node.
Graph 3: Number of nodes Vs packet loss ratio (due to collision)
The packet loss ratio in a network must be kept to the minimum when efficiency of the network is to be high. The experiment we conducted for a bandwidth of 40Mbps to calculate the above gave us the following values.
Table 5: Number of nodes Vs packet loss ratio
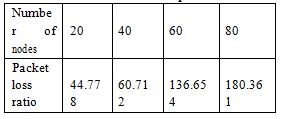
We observe that as the number of nodes increases the number of packets lost due to collision also increases. The packet loss ratio is calculated as the ratio of the number of packets lost due to collision to the number of packets sent. The results are shown in the graph
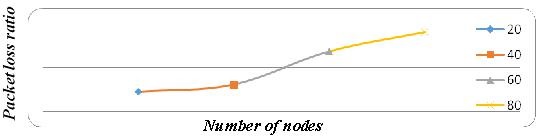
Fig. 3: Number of nodes Vs packet loss ratio
Graph 4: Number of nodes Vs percentage packet loss in IFQ
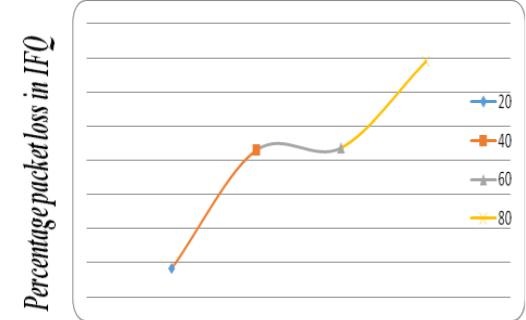
Fig. 4: Number of nodes Vs percentage packet loss Table 6: Number of nodes Vs percentage packet
We observed that even if the number of nodes increases the packet loss ratio in IFQ remains almost same. This is an observed advantage.
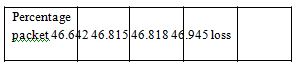
Topology 2Graph 1: Bandwidth Vs Throughput (20 nodes)

Figure 5: Bandwidth Vs Throughput
It is observed that the throughput increases with the increase in the bandwidth. The expected throughput per node in ideal situations is the bandwidth assigned to the network, that is 25 to 45 Mbps in the increments of 5Mbps, in this case.
The observed values, for a fixed 20 nodes, are as follows.
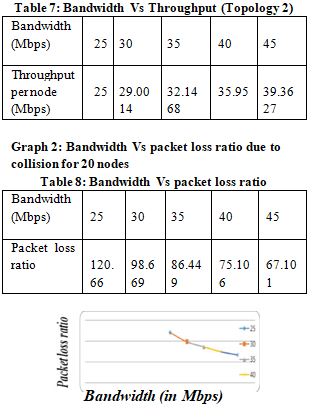
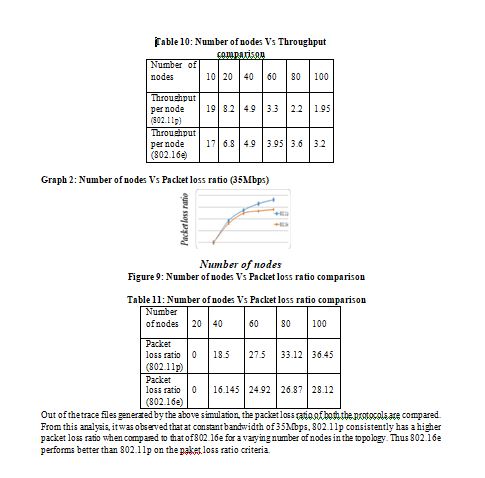
Figure 6: Bandwidth Vs packet loss ratio
 IV. CONCLUSIONS
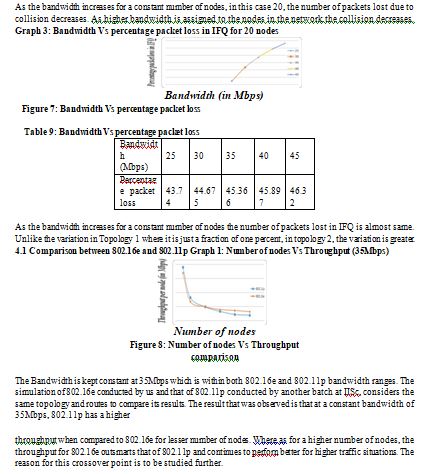
From the experiments conducted, we observe and hence conclude that 802.16e throughput is directly proportional to the bandwidth allocated. The bandwidth range for Mobile WiMAX is 25Mbps to 45Mbps. Hence higher the bandwidth, higher is the efficiency of the WiMAX network. We observe that the packet loss ratio and the loss of packets in IFQ do not change significantly with the change in bandwidth, mobile WiMAX networks are preferred to be used with the allocation of higher bandwidth. The bandwidth in this network is allocated on a per cluster basis. As a result the increase in the number of nodes in these clusters leads to decrease in the throughput per node of the network. Also the increase in the number of nodes does not cause the loss of packets in the IFQ to increase. This acts as an advantage with respect to the scalability of the network. The Mobile WiMAX network is found to perform better than WAVE. The measured values of both the metrics substantiate that Mobile WiMAX is a better networking technology for VANETs with large network size, which is typically the case.
REFERENCES
- Raya, M., & Hubaux, J. (2005). The security of vehicular ad hoc networks. In Proceedings of the 3rd ACM workshop on security of ad hoc and sensor networks (SASN 2005) (pp. 1–11), Alexandria, VA
- Harsch, C., Festag, A., & Papadimitratos, P. (2007). Secure position-based routing for VANETs. In Proceedings of IEEE 66th vehicular technology conference (VTC-2007), Fall 2007 (pp. 26–30), September 2007.
- Gerlach, M. (2006). Full paper: assessing and improving privacy in VANETs. www.network-on-wheels.de/downloads/ escar2006gerlach.pdf(accessed: May 29, 2010).
- Jinyuan, S., Chi, Z., & Yuguang, F. (2007). An ID-based framework achieving privacy and nonrepudiation. In Proceedings of IEEE vehicular ad hoc networks, military communications conference (MILCOM 2007)(pp. 1–7), October 2007.
- Stampoulis, A., & Chai, Z. (2007). A survey of security in vehicular networks. http://zoo.cs.yale.edu/~ams257/projects/wireless-survey.pdf(accessed: May 29, 2010).
- Balon, N. (2006).Introduction to vehicular ad hoc networks and the broadcast storm problem.