Research Paper
SGVU Journal of Pharmaceutical Research & Education
Journal homepage: http://www.gyanvihar.org/researchjournals/
2D AND 3D QSAR STUDIES ON THIAZOLES AND OXADIAZOLES HAVING ANTIPLATELET ACTIVITY BY MULTIPLE REGRESSIONS FORWARD, PRINCIPLE COMPONENT REGRESSION FORWARD AND PARTIAL LEAST SQUARE REGRESSION FORWARD METHOD
- A. Kashid *1, S. K. Singh1, P. B. Patil1, J. Saravanan2
Suresh Gyan Vihar University1, Mahal Jagatpura, Jaipur – 302017, Rajasthan, India.
PES College of Pharmacy2, Bangalore – 560050, Karnataka, India.
Abstract
Thiazole analogues’ antiplatelet action was recently discovered. Principal component analysis, partial least squares, multiple regression, and k-NN MFA 3-Dimensional Simulations of QSAR have been created. Considering the q2 and pred r2 values, either of these models was chosen. Through cross-validation (pred r2) and q2 validation, the chosen model demonstrated a strong intrinsic and extrinsic prognosis for the training-set and test-set dimensions of 63 and 10 analogues respectively. To create correlations between the physical and chemical characteristics of chemicals as well as their platelet inhibition actions and to produce a trustworthy quantitative prediction model, thiazole derivative QSAR analysis has been employed. The best model demonstrated by the 3-Dimensional QSAR analysis was completed using the partial least-square regression-forward technique with a r2 value of 0.93, while the best model for the 2-Dimensional QSAR study was reported using the multiple regression-forward methods with a r2 value of 0.912 and strong predictive power. Future designs of more effective anticancer congeners may be based on the findings from QSAR investigations.
Keywords: Antiplatelet Action, Thiazole analogs, and 3-Dimensional and 2-Dimensional QSAR.
Introduction
The term Quantitative Structure-Activity Relationship (QSAR) refers to a plan for creating computational or quantitative designs It employs a chemometric approach in an effort to find a significant correlation association among structure/function The structure in drug design relates to the characteristics or descriptors of the analogues, and the function of their substituents corresponding to an experimental measure of interaction energy fields endpoint in biology or biochemistry, such as lethality, effectiveness, high affinity, or rate constants. Chemo metric methods involve GA, ANN, PCR, PCA, PLS, MLR, etc. When a property in addition to pharmacological activities is involved, the term “quantitative structure-property relationship” (-QSPR) is often used. Over the course of more than a century, several QSAR techniques have been steadily developed and are indeed statistical inferences tools, notably in the development of medicines and agrochemicals.
By way of Crammers 3-dimensional QSAR and, Vedani’s-fifth, Hopfinger’s -fourth and Free-sixth Wilson’s aspects, approaches had advanced from Hansch and Free-one Wilson’s or 2-dimensional linear free energy correlations. The term “classical” QSAR approaches refer to all one-, two-, and related procedures. Every chemical used ties to the same in the research receptor at the equivalent location. The primary distinction between all of these formalisms, however, is in how each one approaches, depicts, and extracts the quantitative correlations among of properties and potency of the molecules. Due to the opportunity limitations and the reliance on electrostatic, steric, or hydrophobic characteristics
Materials and Methods
The data set for the QSAR investigation includes every synthesized derivative with antioxidant activity. This dataset’s antioxidant activity is described as IC50 digits. Chemically, the structures were created using 2-Dimensional Draw software and V-Life MDS apps then transformed to 3-Dimensional. (V-Life sciences Pvt Ltd Pune). The MMFF 94 force field and Gasteiger Marsili charges were used to single-point optimize each structure until a gradient of 0.001 kcal/A0 was achieved. By using template base alignment, the optimized molecule should be aligned. The table includes the general structures and appropriate replacements.
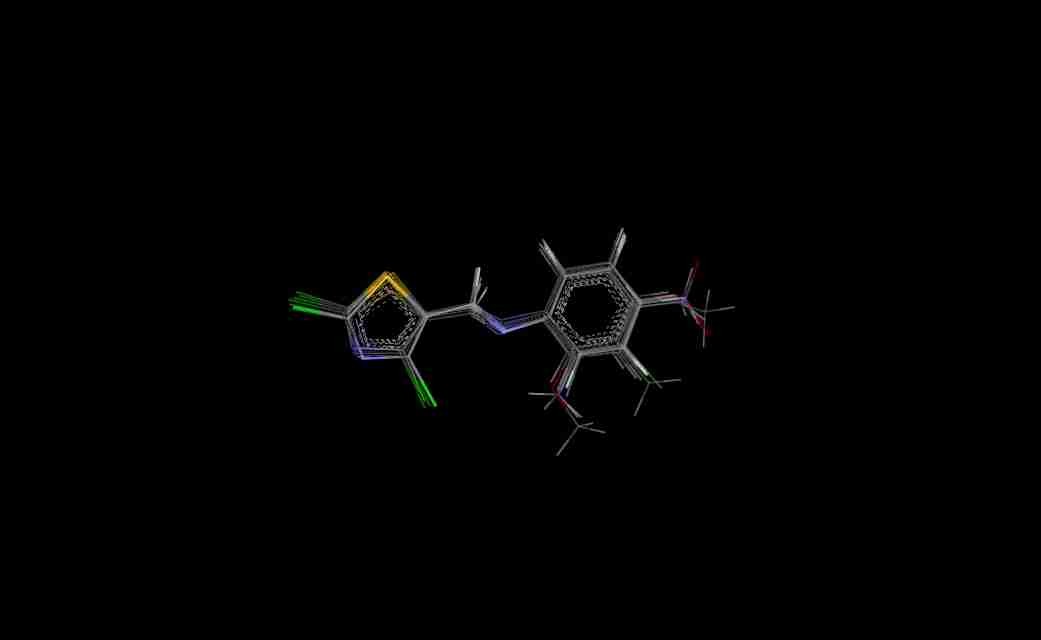
Figure 1 illustrates a 3–Dimensional representation of the alignment of the GS 1a to GS 1l derivatives using the template base.
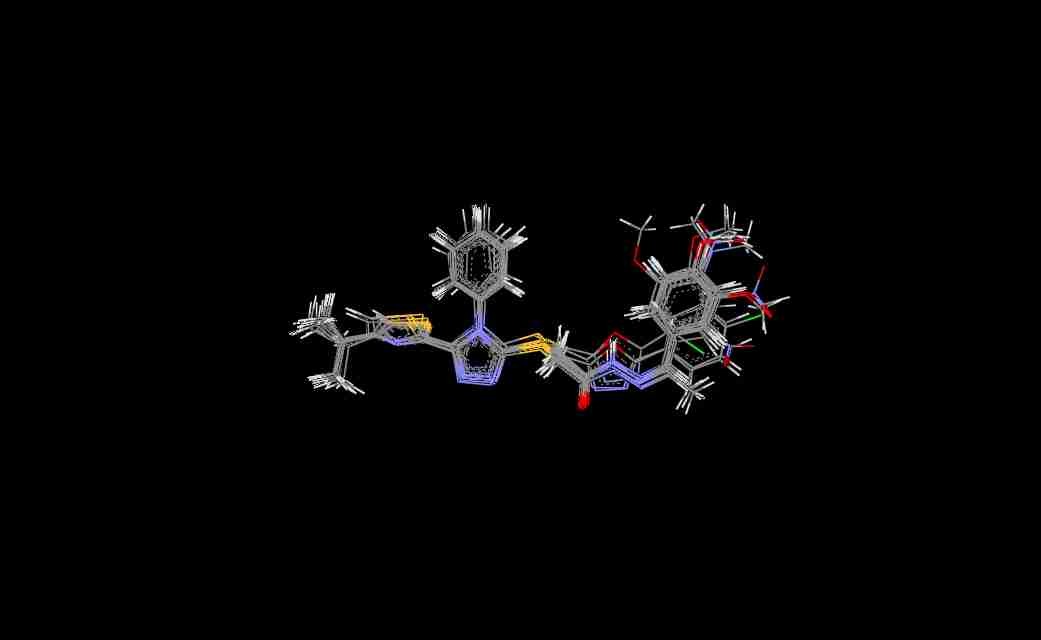
Figure 2 illustrates a 3–Dimensional representation of the alignment of the GS 2ia to GS 4c derivatives using the template base.
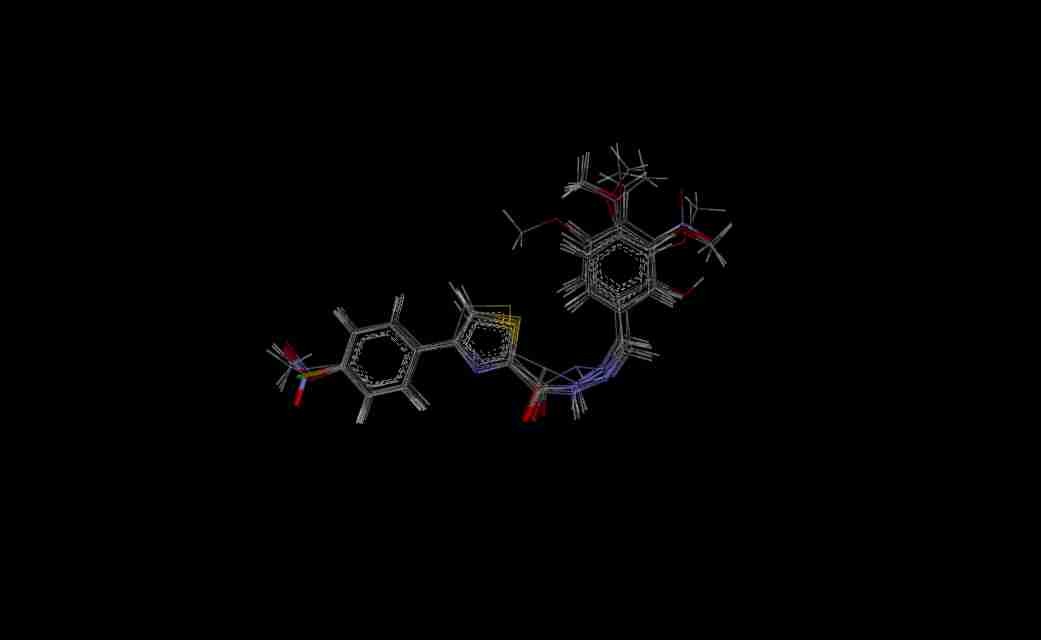
Figure 3 illustrates a 3–Dimensional representation of the alignment of the GS 5ia to GS 7id derivatives using the template base.
Figure 4 illustrates a 3–Dimensional representation of the alignment of the GS 8ia to GS 8im derivatives using the template base.
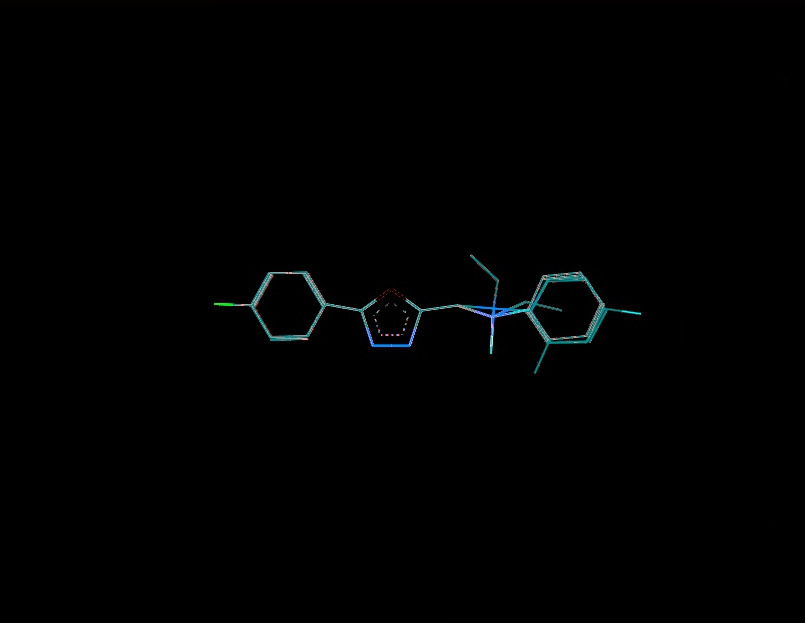
Figure 5 illustrates a 3–Dimensional representation of the alignment of the GS 9ia to Gs 9ii derivatives using the template base.
|
Sr. No. |
Comp. No. | Activity | log | Negative log |
| 1 | GS1a | 156.19 | 2.183 | -2.183 |
| 2 | GS1b | 164.49 | 2.206 | -2.206 |
| 3 | GS1c | 144.58 | 2.160 | -2.160 |
| 4 | GS1d | 63.68 | 1.804 | -1.804 |
| 5 | GS1e | 97.41 | 1.988 | -1.988 |
| 6 | GS1f | 36.86 | 1.566 | -1.566 |
| 7 | GS1g | 98.54 | 1.993 | -1.993 |
| 8 | GS1h | 206.20 | 2.304 | -2.304 |
| 9 | GS1i | 131.35 | 2.108 | -2.108 |
| 10 | GS1j | 100.33 | 2.001 | -2.001 |
| 11 | GS1k | 187.25 | 2.272 | -2.272 |
| 12 | GS1l | 63.12 | 1.800 | -1.800 |
| 13 | GS2ia | 181.57 | 2.272 | -2.272 |
| 14 | GS2ib | 97.07 | 1.981 | -1.981 |
| 15 | GS2ic | 123.49 | 2.045 | -2.045 |
| 16 | GS2id | 92.35 | 1.956 | -1.956 |
| 17 | GS2ie | 58.22 | 1.764 | -1.764 |
| 18 | GS2if | 120.47 | 2.071 | -2.071 |
| 19 | GS2ig | 124.29 | 2.118 | -2.118 |
| 20 | GS2ih | 13.09 | 1.107 | -1.107 |
| 21 | GS2ii | 32.46 | 1.439 | -1.439 |
| 22 | GS2ij | 62.10 | 1.823 | -1.823 |
| 23 | GS2ik | 25.72 | 1.465 | -1.465 |
| 24 | GS3a | 35.18 | 1.457 | -1.457 |
| 25 | GS3b | 84.18 | 1.851 | -1.851 |
| 26 | GS3c | 11.78 | 1.065 | -1.065 |
| 27 | GS4a | 40.33 | 1.507 | -1.507 |
| 28 | GS4b | 89.18 | 1.850 | -1.850 |
| 29 | GS4c | 13.63 | 1.238 | -1.238 |
| 30 | GS5ia | 131.35 | 2.019 | -2.019 |
| 31 | GS5ib | 17.30 | 1.230 | -1.230 |
| 32 | GS5ic | 106.89 | 2.023 | -2.023 |
| 33 | GS5id | 18.53 | 1.260 | -1.260 |
| 34 | GS6ie | 92.03 | 1.963 | -1.963 |
| 35 | GS6ia | 100.75 | 2.103 | -2.103 |
| 36 | GS6ib | 31.14 | 1.485 | -1.485 |
| 37 | GS6ic | 20.27 | 1.319 | -1.319 |
| 38 | GS7ia | 81.34 | 1.881 | -1.881 |
| 39 | GS7ib | 146.91 | 2.177 | -2.177 |
| 40 | GS7ic | 92.67 | 1.966 | -1.966 |
| 41 | GS7id | 27.19 | 1.236 | -1.236 |
| 42 | GS8ia | 99.85 | 2.001 | -2.001 |
| 43 | GS8ib | 94.54 | 1.975 | -1.975 |
| 44 | GS8ic | 12.65 | 1.102 | -1.102 |
| 45 | GS8id | 97.87 | 1.992 | -1.992 |
| 46 | GS8ie | 93.81 | 1.963 | -1.963 |
| 47 | GS8if | 32.01 | 1.516 | -1.516 |
| 48 | GS8ig | 48.41 | 1.655 | -1.655 |
| 49 | GS8ih | 109.48 | 2.019 | -2.019 |
| 50 | GS8ii | 90.61 | 1.857 | -1.857 |
| 51 | GS8ij | 119.71 | 2.068 | -2.068 |
| 52 | GS8ik | 26.86 | 1.419 | -1.419 |
| 53 | GS8il | 132.64 | 2.1211 | -2.120 |
| 54 | GS8im | 160.51 | 2.551 | -2.551 |
| 55 | GS9ia | 54.51 | 1.633 | -1.633 |
| 56 | GS9ib | 109.19 | 2.021 | -2.021 |
| 57 | GS9c | 25.49 | 1.418 | -1.418 |
| 58 | GS9id | 41.29 | 1.517 | -1.517 |
| 59 | GS9ie | 20.81 | 1.310 | -1.310 |
| 60 | GS9if | 86.64 | 1.838 | -1.838 |
| 61 | GS9ig | 68.25 | 1.735 | -1.735 |
| 62 | GS9ih | 19.32 | 1.268 | -1.268 |
| 63 | GS9ii | 161.04 | 2.217 | -2.217 |
Table No- 1 Pharmacological Performance
- Database of Pharmacological Performance for QSAR Interpretation
These novel molecules’ antioxidant activity and structural details are listed in the table, which is crucial for 2D and 3D-QSAR research.
1.1 Computational Specifications
All compound structures were depicted using the 2D-Sketch software (MDS 2020). In MDS, the 2D analogs were transformed into 3D-analogues. Merck Molecular Force Field (MMFF) and charges were used to batch optimize each chemical and reduce its energy consumption.
1.2 2D-QSAR Molecular Simulation
1.2.1 Calculation of Descriptors:
Using the descriptor computation feature included in the MDS technology, the Physico-chemical Parameter, Alignment Independent, may be computed. There are calculated to be close to several hundred descriptions. Using the “delete invariable column tool,” the column that has both zero-value reading and invariability is eliminated.
1.2.2 Assignment of the Parameter
For creating a Statistical model, there are one hundred molecular descriptors accessible. Not every molecular attribute is crucial for figuring out the biological activity. It is necessary to use a variable selection approach, which is crucial in assessing activity, to choose the best subset of the descriptors. The step-by-step forward-backward systemic variable selection approach can be used to pick the variables. The log of the IC50 value, which may be employed as a dependent variable in a QSAR analysis, is created from the IC50 value. Create a separate variable for each additional attribute.
1.2.3 Quantitative Approaches
Statistics are analyzed in to be able to create Statistical simulations by using a subset of variables that have the highest statistical significance in predicting the pharmacology potency using an appropriate statistical approach in conjunction with a variable selection method.
1.2.4 Training and test data readiness:
Two sets, training, and test sets can be created according to a set of data. Template base alignment should be used to align optimized molecules. The table contains the general structures and the relevant replacements.
1.2 3D-QSAR Molecular Simulation:
Training and test- data readiness:
Training and test-set may be created using the 3–Dimensional QSAR data collection. By using template base alignment, the optimized compound must be aligned. The table includes basic structures and the appropriate replacements. Similar to 2–Dimensional QSAR of the same molecule, descriptor computation, variable selection, and statistical approaches are used.
| Quantitative Structural-Activity Relationship Techniques | 2-Dimensional QSAR specification | ||||
| Two Set | Assigned Variables/Descriptors | Component/Coefficient | Constant | Analytical statistics | |
| Multiple regressions- Forward Techniques | Training-Set dimensions Size = 63, Test-Set dimensions = 10 | Quadrupol-2, MomInertia-X, Zcomp-Dipole, QMDipole -Y | 0.018 (± 0.02), -0.010 (± 0.01), 0.0277 (± 0.018), 0.0752 (± 0.031) | 0.85 | n = 63, Degree of freedom = 14, F-test = 68.19, r2 se =0.02, q2 se = 0.04, pred_r2 =-3.48, pred_r2se =0.30, r2 = 0.96, q2 =0.92, |
| Principle Component Regression- Forward Techniques | Training-Sets dimensions Size= 63, Test-Sets dimensions = 10 | Quadrupol-2, Zcomp-Dipole | 0.005, -0.112, 0.022 | 1.641 | Optimum Components = 4, n = 63 Degree of freedom = 15,
F-test = 21.47, r2 se = 0.069, q2 s = 0.100, pred_r2 = -1.14, pred_r2se=0.215, r2 = 0.758, q2 = 0.616 |
| Quantitative Structural -Activity Relationship Techniques | 3- Dimensional QSAR specification | ||||
| Two Set | Assigned Variables/Descriptors | Component/Coefficient | Constant | Analytical statistics | |
| Multiple Regression-
GS 1a – Gs 1k |
Training-Sets dimensions Size = 63, Test-Set dimensions = 10 | E_78 E_289 E_141 |
-0.110 (±0.08) 0.052 (±0.062) 0.024 (±0.069) |
1.767
|
n = 63, Degree of freedom = 10, F-test = 2.52, r2 se =0.28, q2 se = 1.12
pred_r2= 0.72, pred_r2se = 0.13, r2 = 0.64, q2 = 0.26 |
| Model i)
|
Balance Equation I
Log-MIC =-0.110 (±0.08 )E_78 + 0.052 (±0.062)E_289+0.024 (±0.069)E_141 + 1.76 |
||||
| Multiple Regression-
GS 2ia to GS 4c |
Training-Sets dimensions Size = 63, Test-Set dimensions = 10 | S_49 E_27 H_6 |
5.869 (± 1.72) -0.134 (± 0.019) -2.167 (± 0.34) |
0.14
|
n = 63, Degree of freedom = 12, F-test =5.14, r2 se =0.17, q2 se =0.12
pred_r2 =-8.29, pred_r2se = 0.14, r2 = 0.69, q2 =0.11, |
| Model ii)
|
Balance Equation II
Log-MIC = 5.869 (± 1.72) S_-0.134 (± 0.019) E_27–2.167 (± 0.34) H_6 + 0.14 |
||||
| Multiple Regression
GS 5ia to GS 7id |
Training-Sets dimensions Size = 63, Test-Set dimensions = 10 | H_19 H_33 S_14 |
2.12 (± 0.19) 0.54 (± 0.24) -4.01 (± 0.56) |
6.2 | n = 63, Degree of freedom =11, F-test = 8.05, r2 se = 0.04, q2 se = 0.06
pred_r2 = -74.62, pred_r2se = 0.23, r2 = 0.85, q2 = 0.54, |
| Model iii)
|
Balance Equation III
Log-MIC = 2.12 (± 0.19) H_19 0.54 (± 0.24) H_33–4.01 (± 0.56) S_142 + 6.2 |
||||
| Multiple Regression
GS 8ia to GS 8im |
Training-Sets dimensions Size = 63, Test-Set dimensions = 10 | H_39 S_12 H_18 |
5.91 (± 0.03) 164.37 (± 37.01) -6.17 (± 0.03) |
10.55 | n = 63, Degree of freedom = 12, F-test = 11.38, r2 se = 0.03, q2 se = 0.07
pred_r2 = -0.11, pred_r2se = 0.063, r2 = 0.87, q2 = 0.65, |
| Model iv)
|
Balance Equation IV
Log-MIC = 5.92 (± 0.04) H_39 +154.37 (± 37.02) S_12 + -6.16 (± 0.03) H_18 + 10.55 |
||||
| Multiple Regression
GS 9ia to GS 9ia |
Training-Sets dimensions Size = 63, Test-Set dimensions = 10 | H_30 S_11 S_31 |
-0.502 (± 0.001) -7.15 (± 1.53) -7.32 ( ± 0.12) |
-3.74 | n = 63, Degree of freedom = 12, F-test =217.1, r2 se =0.008, q2 se =0.02
pred_r2 =-12.2, pred_r2se = 0.146, r2 =0.99, q2 = 0.96, |
| Mode v)
|
Balance Equation V
Log-MIC = -0.502 (± 0.001) H_30+-7.15 (± 1.53)S_11–7.32 ( ± 0.12) S_34-3.74 |
||||
| Principle Component Regression- Forward Techniques | Training-Sets dimensions Size = 63, Test-Set dimensions = 10 | E_94, S_74, S_112, E_52 | -0.106, 3.517, -0.119, 0.117 | 0.72 | Optimum Components = 4, n = 63, Degree of freedom = 11, F-test = 0.45, r2 se =0.03, q2 se = 0.1 5, pred_r2 =-2.64, pred_r2se =0.27, r2 =0.95, q2 =0.90, |
| Model vi)
|
Balance Equation VI
Log-MIC = -0.106E_94 +3.517S_74 -0.119 S_112 + 0.117 E_52 +0.72 |
||||
| Partial Least Square Regression-Forward Techniques | Training-Sets dimensions Size = 63, Test-Sets dimensions = 10 | E_94, S_74, S_11, E_53 | -0.08, 3.61, -0.22, 0.13 | 0.74 | Optimum Components = 4 n = 63 Degree of freedom = 11, F test =115.29, r2se= 0.010, q2 se = 0.04 pred_r2 =-2.21, pred_r2se = 0.28, r2=0.96, q2 =0.92, |
| Model vii)
|
Balance Equation VII
Log-MIC = -0.08 E_94 + 3.61 S_74 -0.22, S_112 + 0.13 E_53 + 0.74 |
||||
Table N-. 2 : Equations and QSAR techniques for 2-Dimensional and 3- Dimensional
Result and Discussion:
Utilizing the programme V-life MDS -4.6, derivatives of thiazole and oxadiazole chemicals were taken into account for the construction of QSAR models. For an efficient QSAR computation, these datasets are split into training and test-sets. We made sure that molecules in the training and test-sets dimensions were evenly distributed in terms of physical and chemical environment and activity while choosing the training and test sets. The remaining factors were chosen as independent variables, while pharmacological activity was chosen as the dependent variable. For this class of chemicals, the training and test set dimensions of derivatives were chosen at random, and the models/equations were then verified through both intrinsic and extrinsic processes. For discussion, a few QSAR simulations of statistical significance were selected.
Multiple linear regression models in 2-Dimensional QSAR with forward stepwise demonstrate a strong correlation among pharmacological activity and variables. The coefficients of determination QMDipole-Y, MomInertia-X, Quadrupole-2, Zcomp-Dipole and with r2 values of 0.96 and 0.75, being order to articulate 76 percent of the variation in the reported activity indices. Each descriptor made a valuable contribution to the model’s creation. The model’s accuracy is shown by the poor threshold deviation of r2se =0.07, r2 se =0.03. The model was internally validated using the end-up leaving method.
Cross-validated r2 values of 68 percent for the model’s intrinsic predictive ability (q2 = 0.92, q2 = 0.61) indicate that it has a strong intrinsic predictive ability. Additionally, a 99.5 percent reliability in the created model’s nonrandomness was demonstrated by the randomization test, which led to its selection as the QSAR model. The total empirical probability value of the model is 99.5 percent, as indicated by the F-test=78.19, 20.37, which also indicates that the model’s failure probability is 01.0 in 10,000. The variables reveal an interrelationship between variables used for the resulting QSAR model that is progressive. The favorable coefficients imply adding these atoms of carbon to molecules results in an increase in antiplatelet action.
The first matrix of the quadrupole moments’ magnitude is indicated by the quadrupole-2 descriptor. Its significant QSAR model contribution indicates that it will boost potency. Its significant value implies that increasing the quantity of these atoms would improve antiplatelet activity. These atoms enhance the dipole moment., ZcompDipole, MomInertiaX, and QMDipoleY descriptors are examples of a form of dipole-dipole interactions, and their contributions to the platelet aggregation-inhibition actions show that the excellent group has strong antioxidant potential.
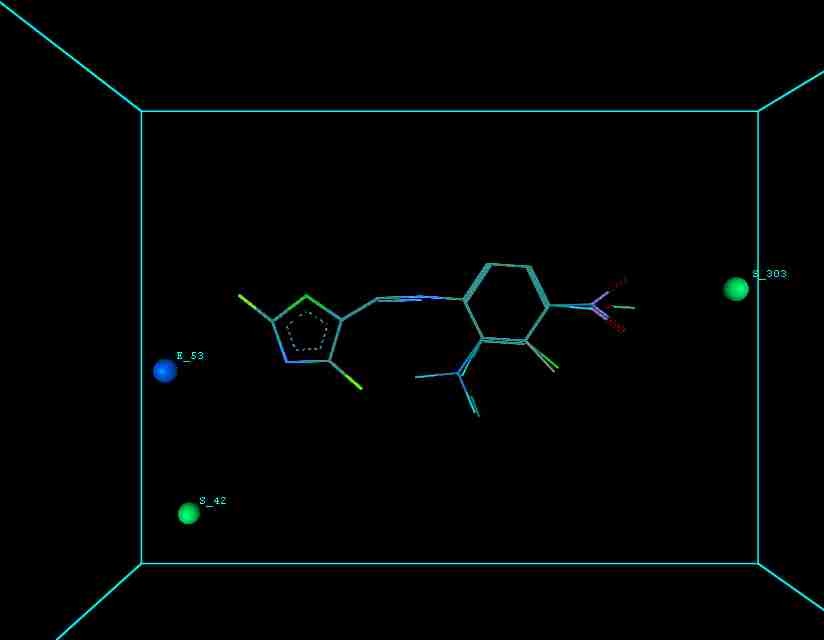
Figure 6 illustrates the 3-Dimensional perspective of aligned analogues and the contribution of GS 1a – GS 1k descriptors.
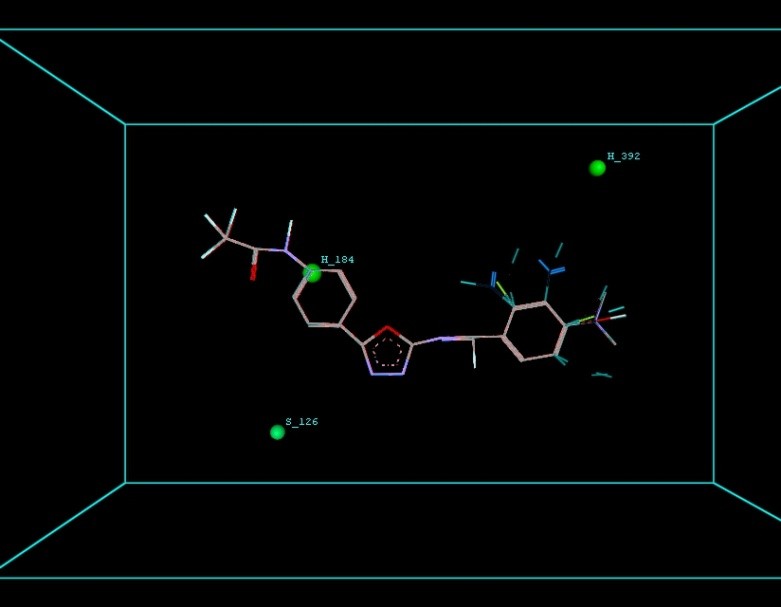
Figure 7 illustrates the 3-Dimensional perspective of an aligned analogues and the contribution of GS 2ia to GS 4c descriptors
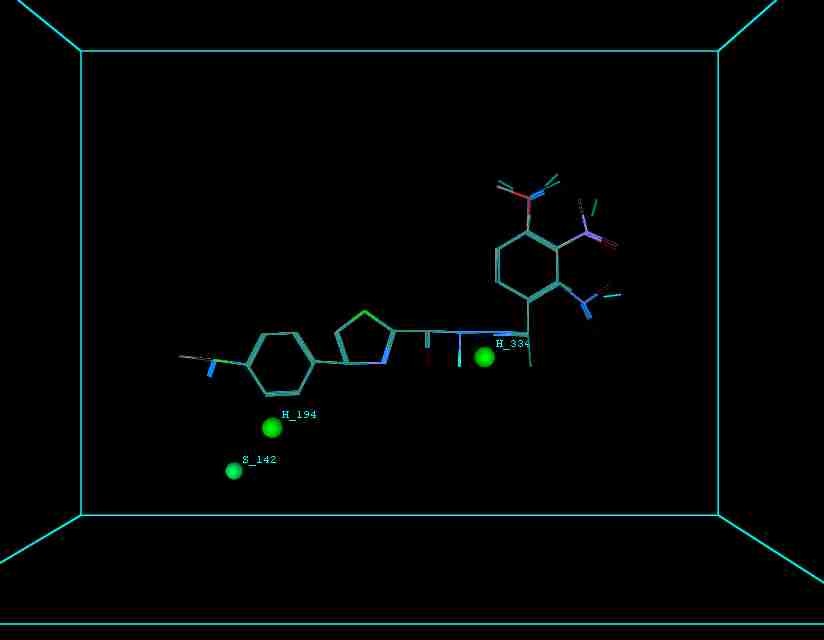
Figure 8 illustrates 3-Dimensional perspective of an aligned analogues and the contribution of GS 5ia to GS 7id descriptors
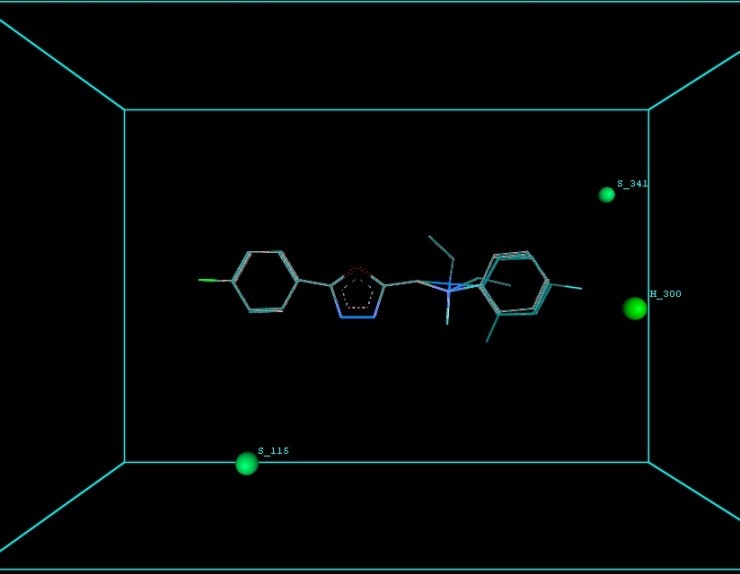
Figure 9 illustrates 3-Dimensional perspective of an aligned analogues and the contribution of GS 8ia to GS 8im descriptors
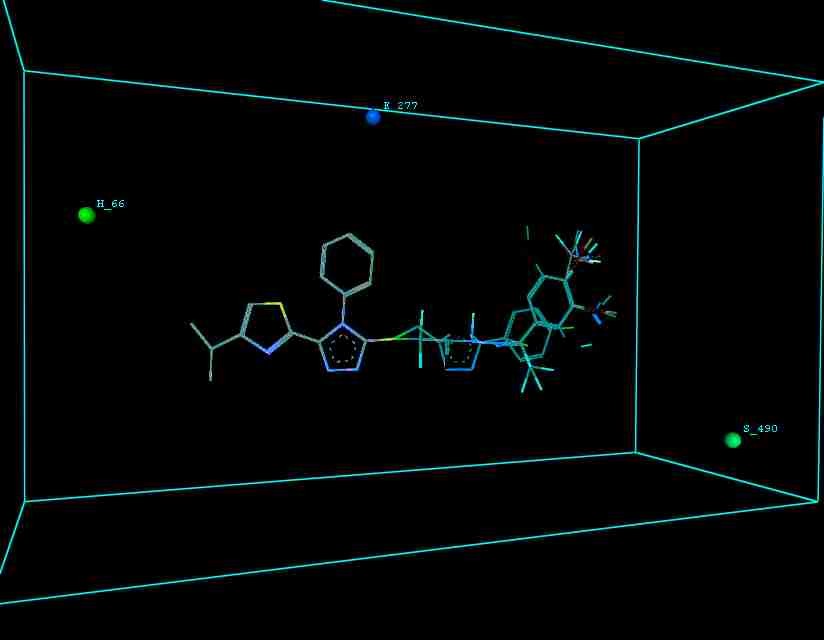
Figure 10 illustrates 3-Dimensional perspective of an aligned analogues and the contribution of GS 9ia to GS 9iI descriptors
Multiple linear regressions with forwarding stepwise and the generated equations in 3-Dimensional QSAR demonstrate the strong correlation between biological activity and variables. With r2 = 0.95, r2= 0.64, r2= 0.85, r2= 0.69, r2= 0.87, r2= 0.99, and r2=0.96, which really is adequate to explain variance in the reported activity indices. The value of q2, which measures a model’s intrinsic predictive capability, and pred r2, which evaluates a model’s potential to forecast the behavior of an external test set, serve as the criteria for selecting a model. Our model appears to be accurate and dependable, according to the cross-validated regression analysis (q2), which was regarded as a gauge of prediction dependability.
The suggested A chance of less than 00.001 exists for the Prediction model. produced by chance, according to the randomization tests. Steric variables and electrostatic variables that contribute to models include E 289, E-141, S-4, H-19, H-33, H-12, H-18, S-11, S-34, S-91, E-94, S-14, S-5, , E-71, H-30, E-277, S-74, S-11, H-6, E-52, E-9 E-78, The models’ indicative power is represented by the q2 values (q2= 0.96, q2= 0.92, q2= 0.54, q2= 0.24, q2= 0.65, q2 = 0.92, q2= 0.90, q2= 0.11, q2= 0.61).
The derived QSAR equation is statistically significant, as shown by the values of F test, r2 se, q2 se, pred r2, and pred r2se, r2, q2, and it demonstrates that the model’s predictive capacity is 75% (Intrinsic validation) and 70%. (Extrinsic validation). Smaller bulky residues are selected in that location because steric potential there’s really advantageous for activity, according to steric descriptors. In a 3-Dimensional image, the field energies of the steric and electrostatic interactions among the probe (methyl) and the compounds are shown. Steric and electrostatic force contributions show that both forces are more significant than the other.
The preferable substitution (a larger or smaller bulkier group) to create increased antioxidant potential is implied by the steric effect, which occurs when the phenyl ring is in the o- or m- position. The electro+ve (Electron withdrawing) groups is favored at the four positions of the Ph-ring, which is supported by an electrostatic description with a significant positive impact surrounding that location.
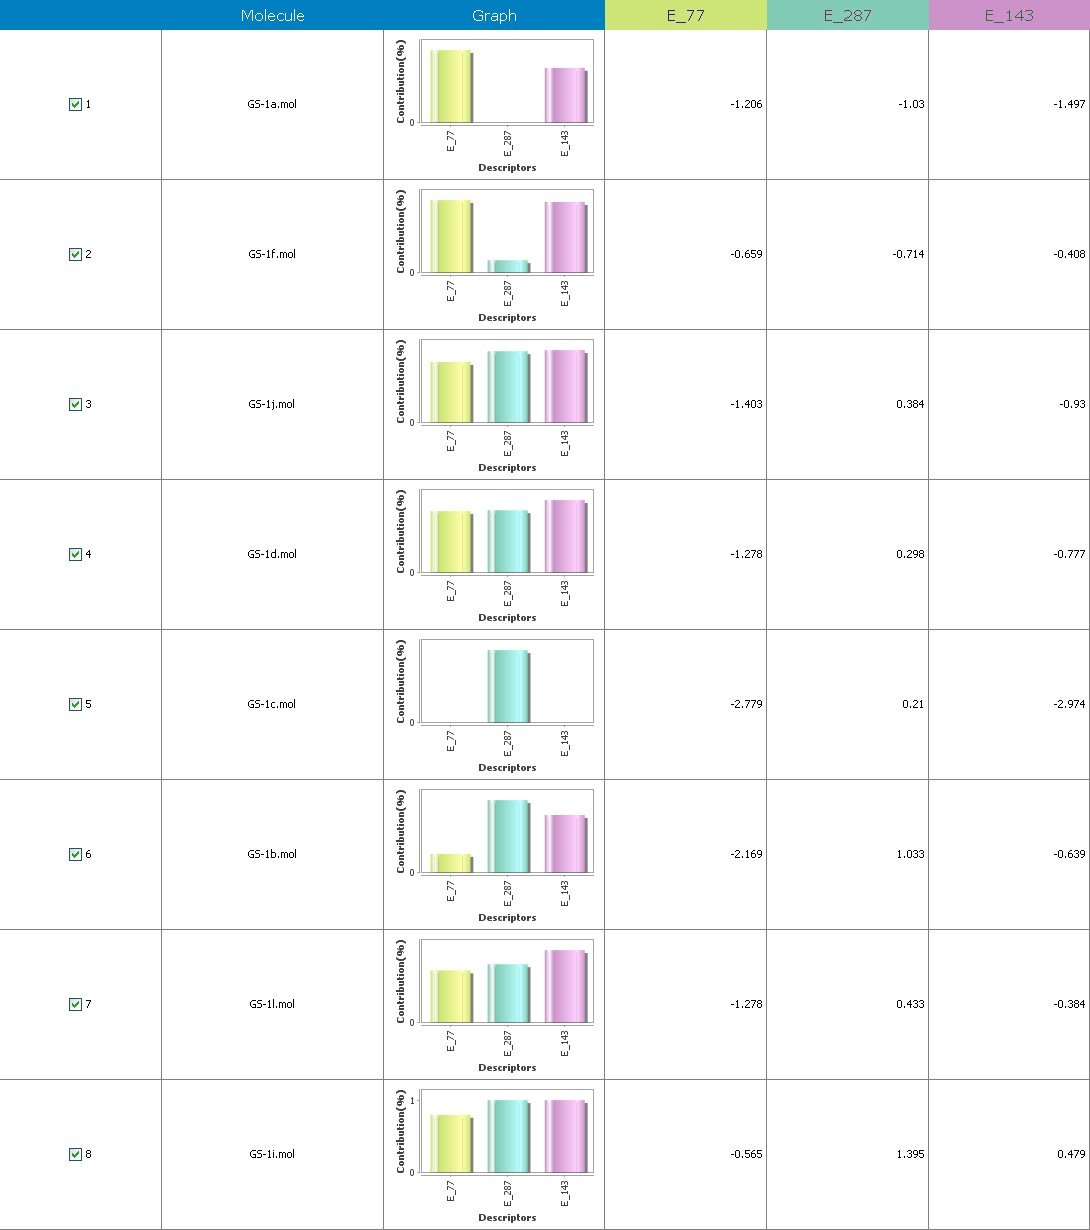
Fig.11 Descriptor participation graphs: GS 1a to GS 1k
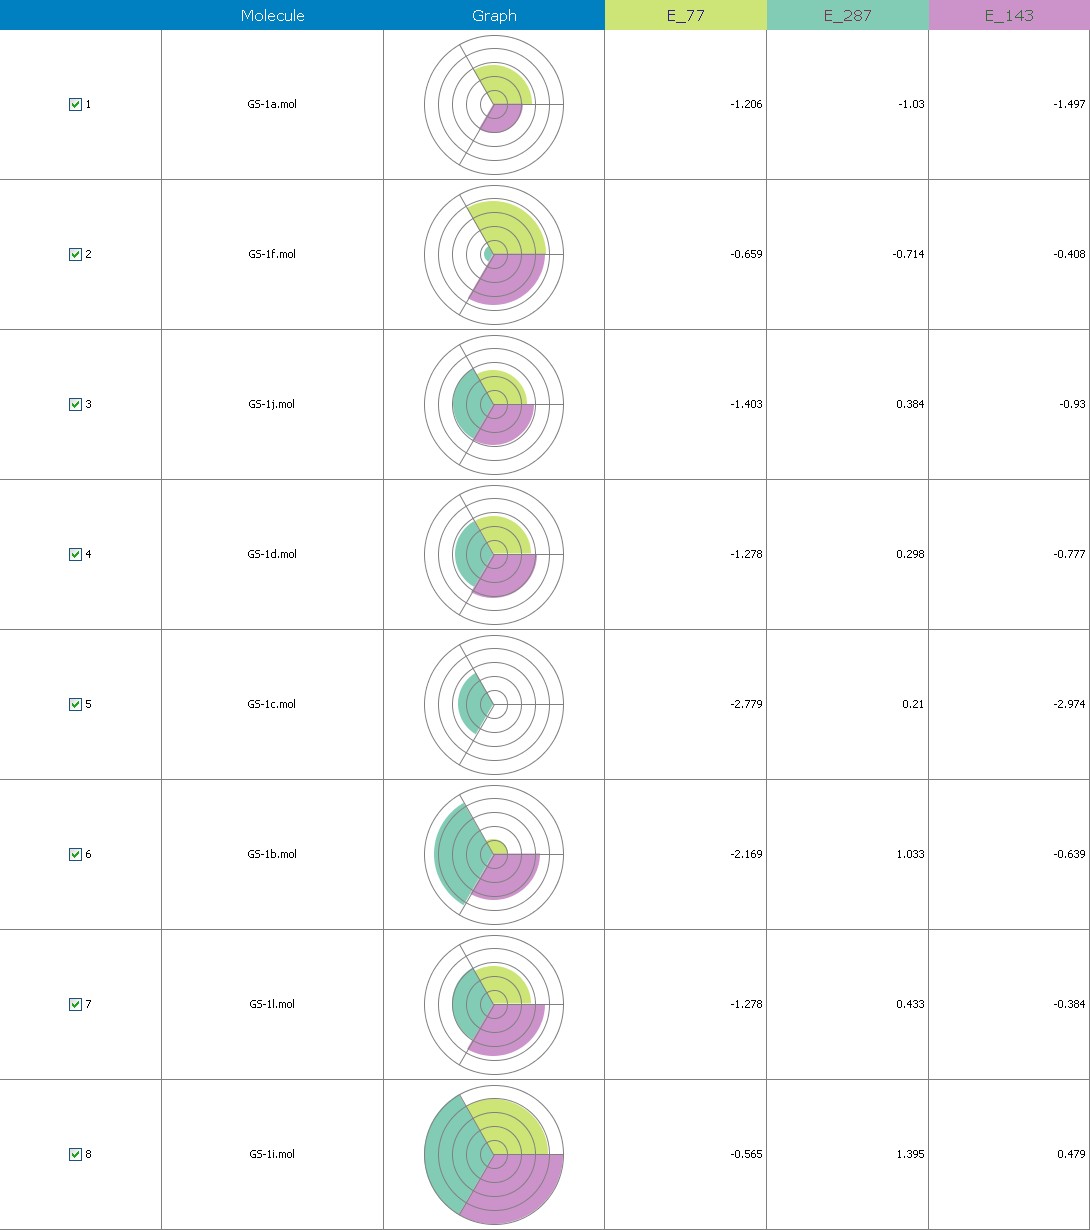
Fig.12 Descriptor participation Pi- graphs: GS 1a to GS 1k
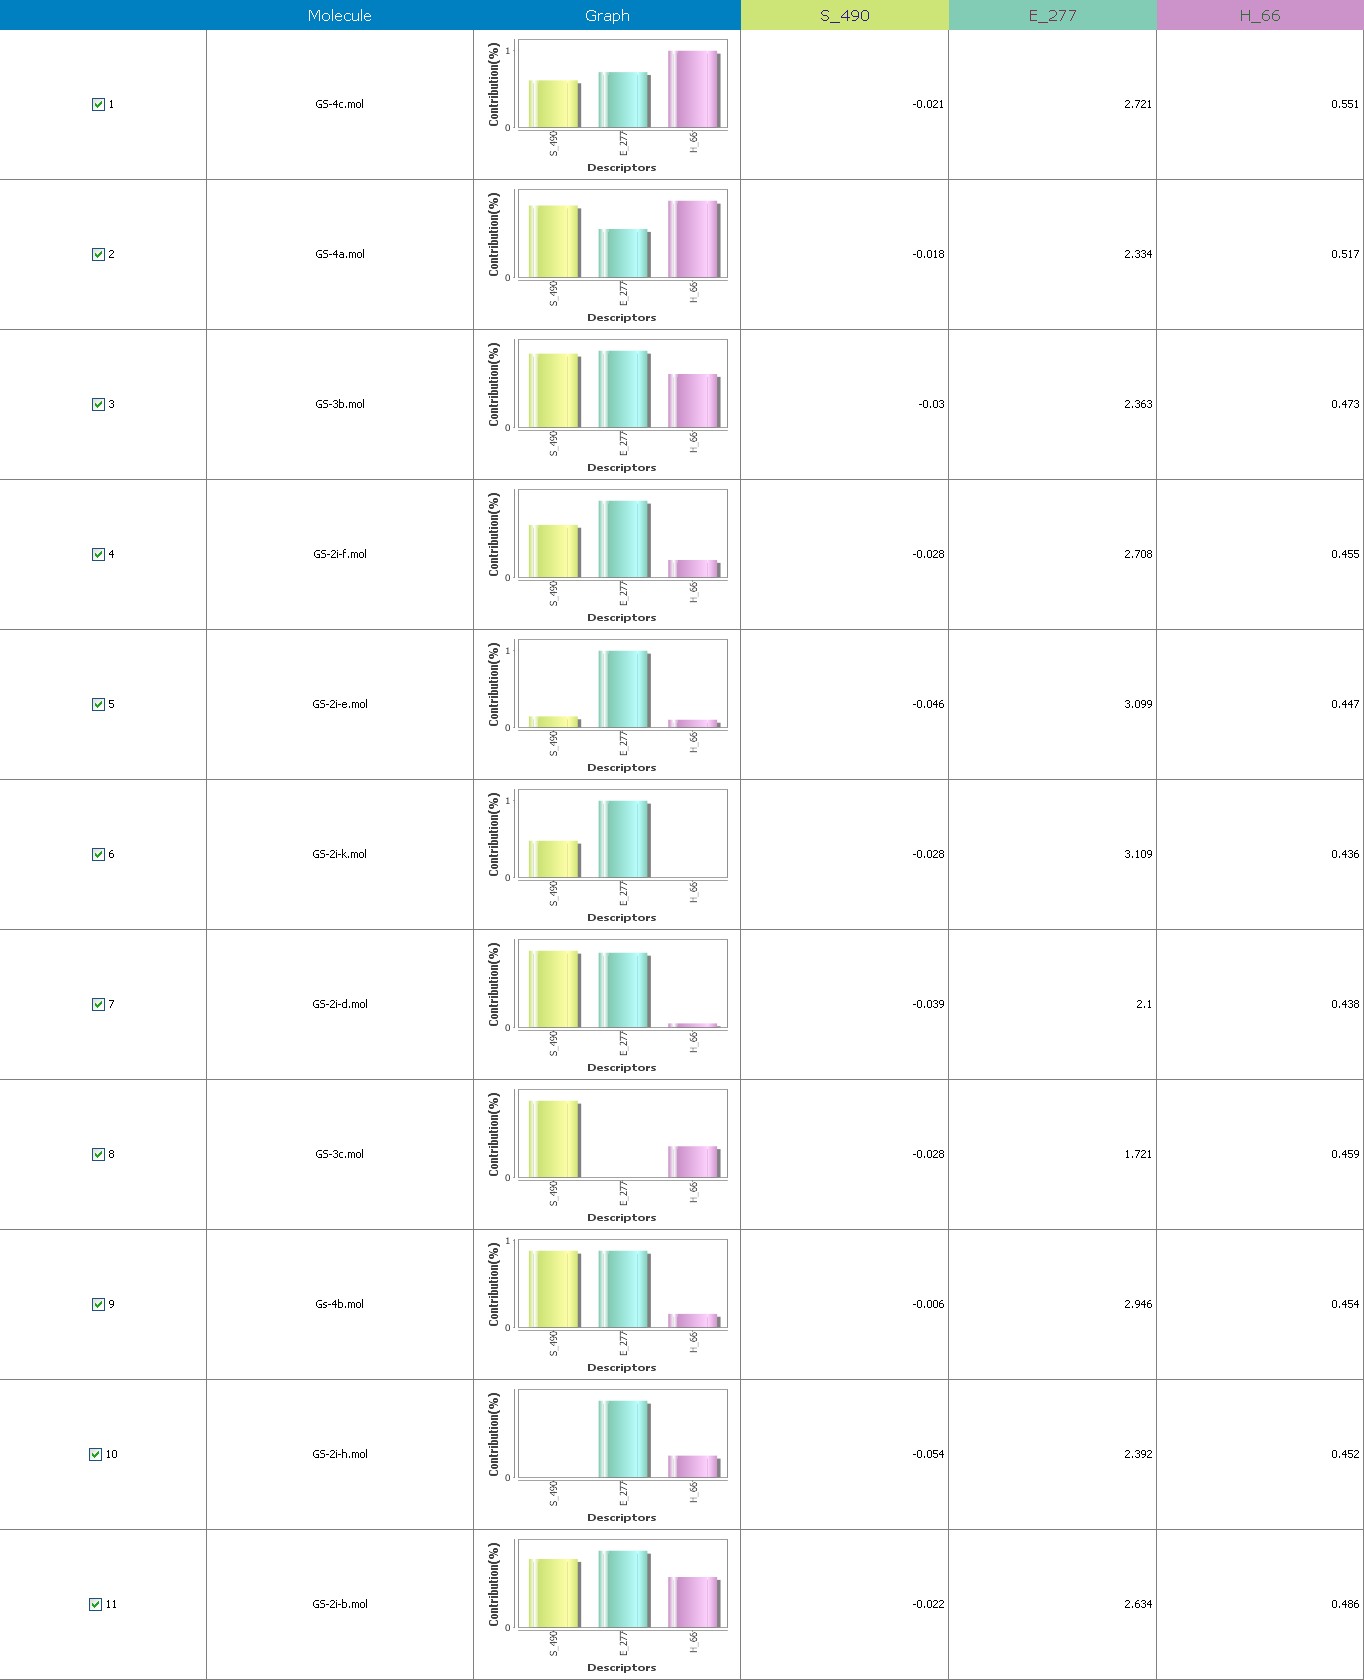
Fig.13 Descriptor participation graphs : GS 2ia to GS 4c
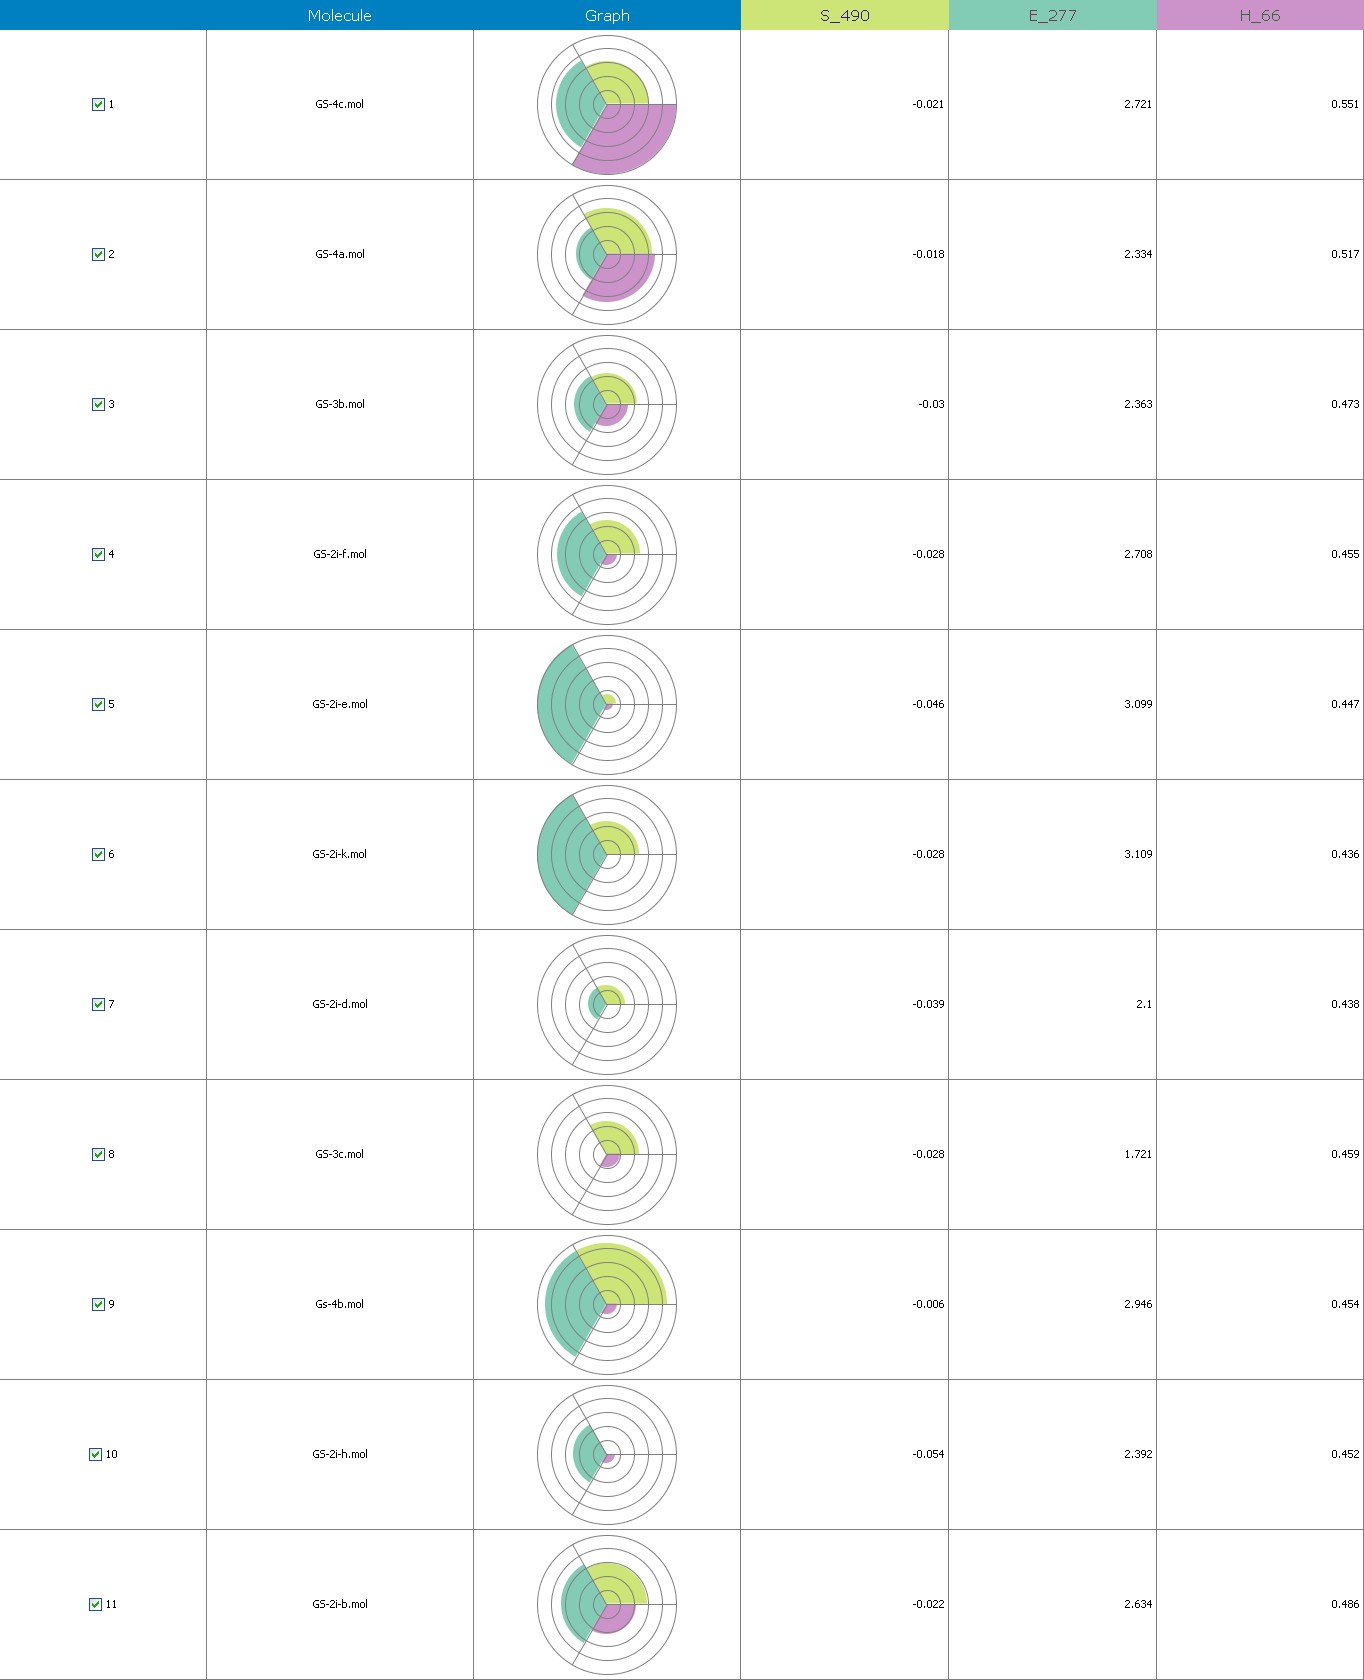
Fig.14 Descriptor participation Pi-graphs: GS 2ia to GS 4c
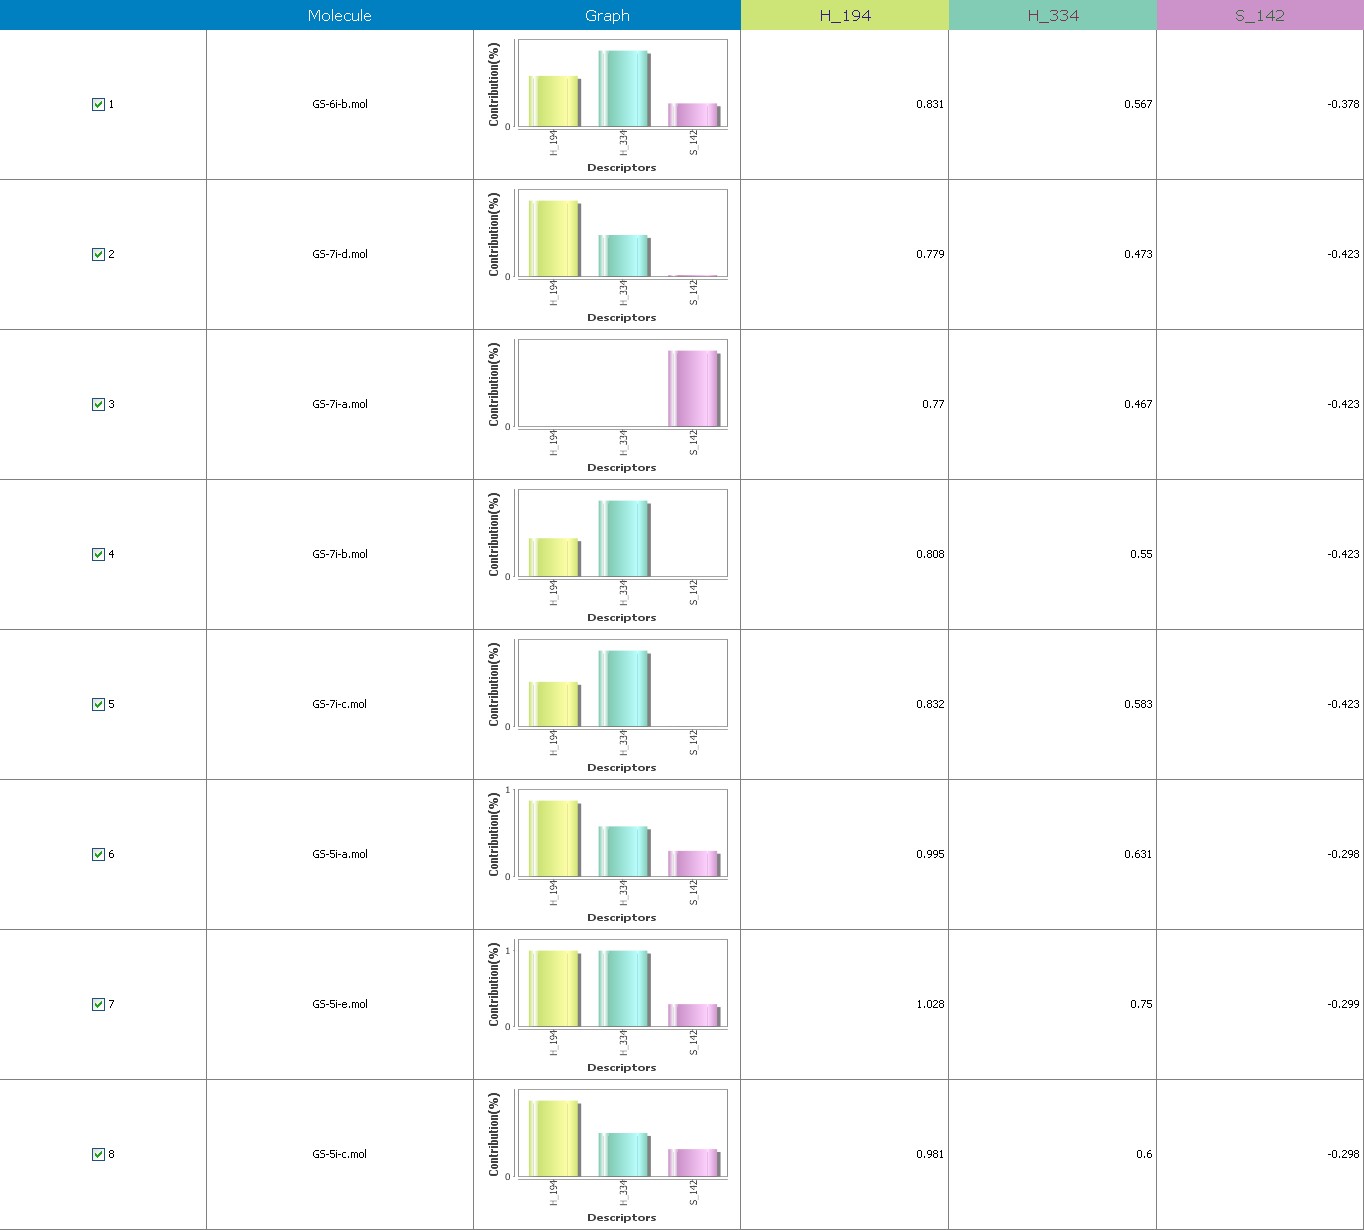
Fig.15 Descriptor participation graphs : GS 5ia to GS 7id
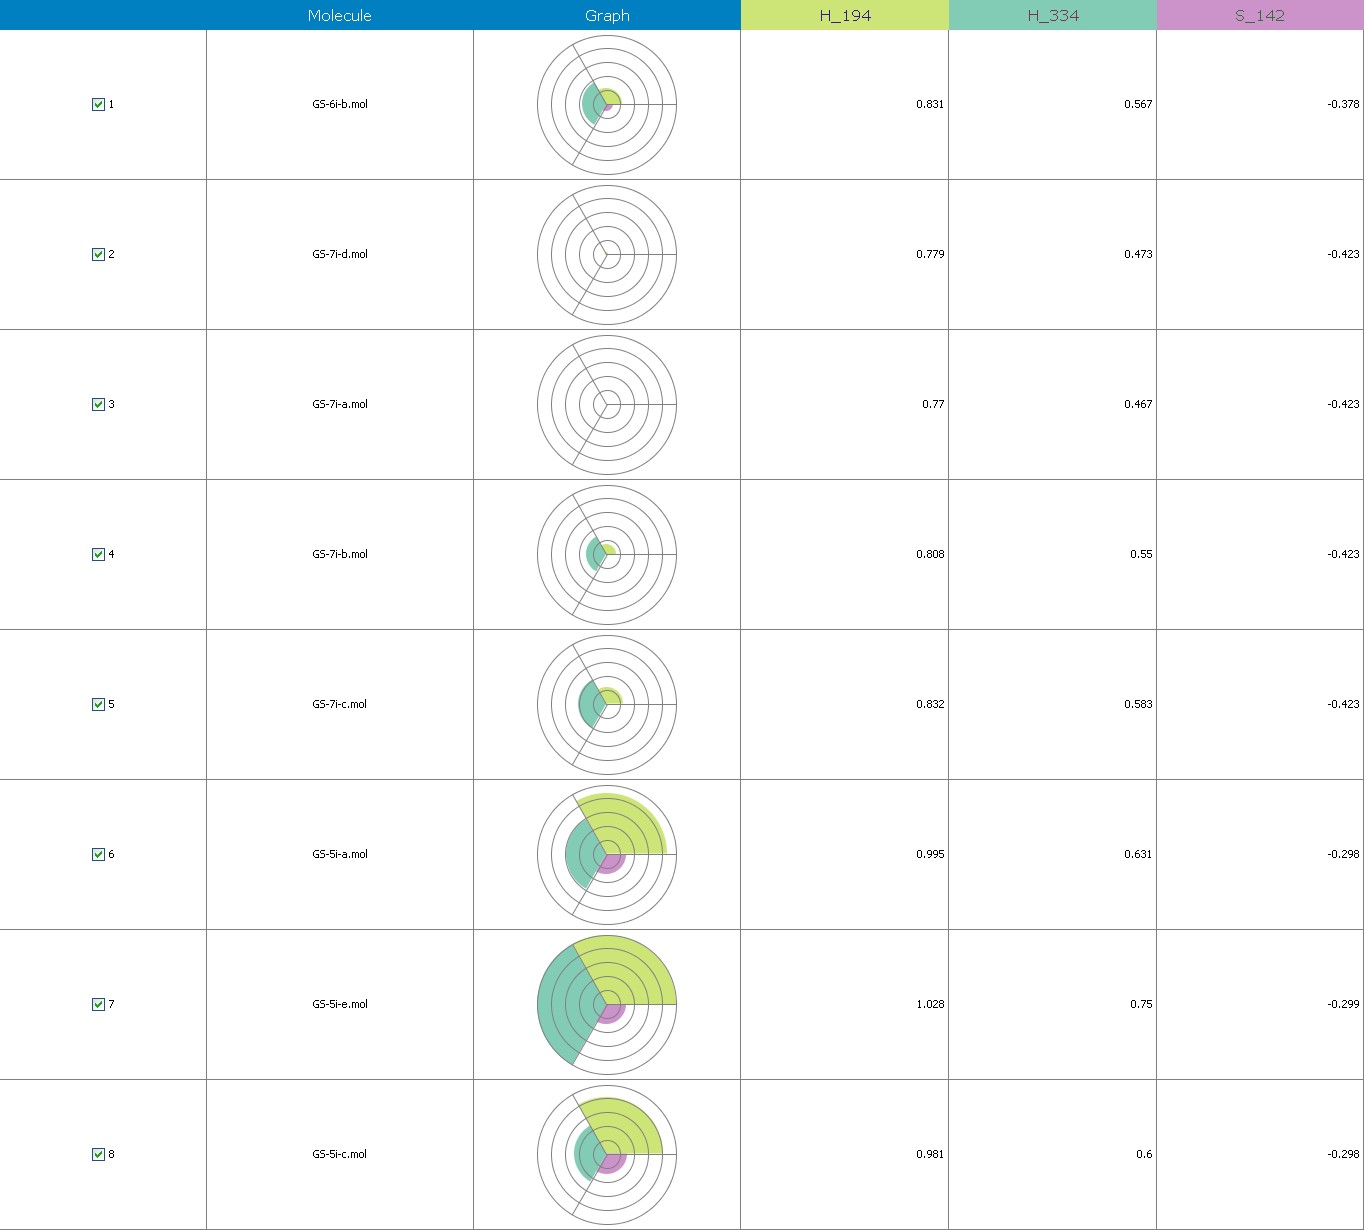
Fig.16 Descriptor participation Pi-graphs: GS 5ia to GS 7id
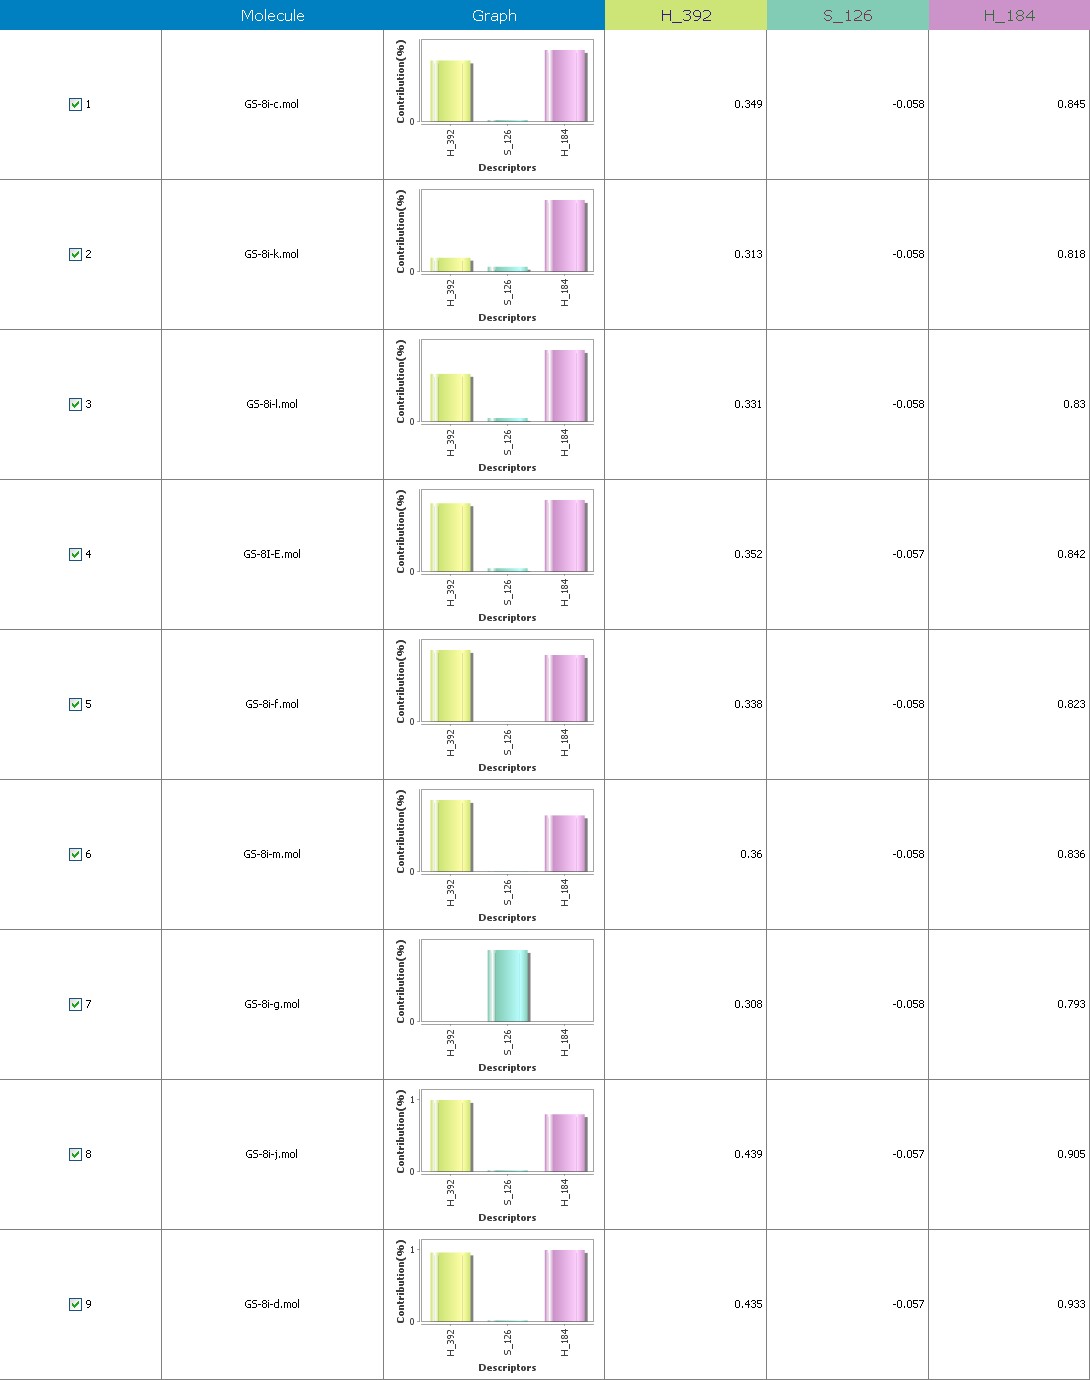
Fig.17 Descriptor participation graphs: GS 8ia to GS 8im
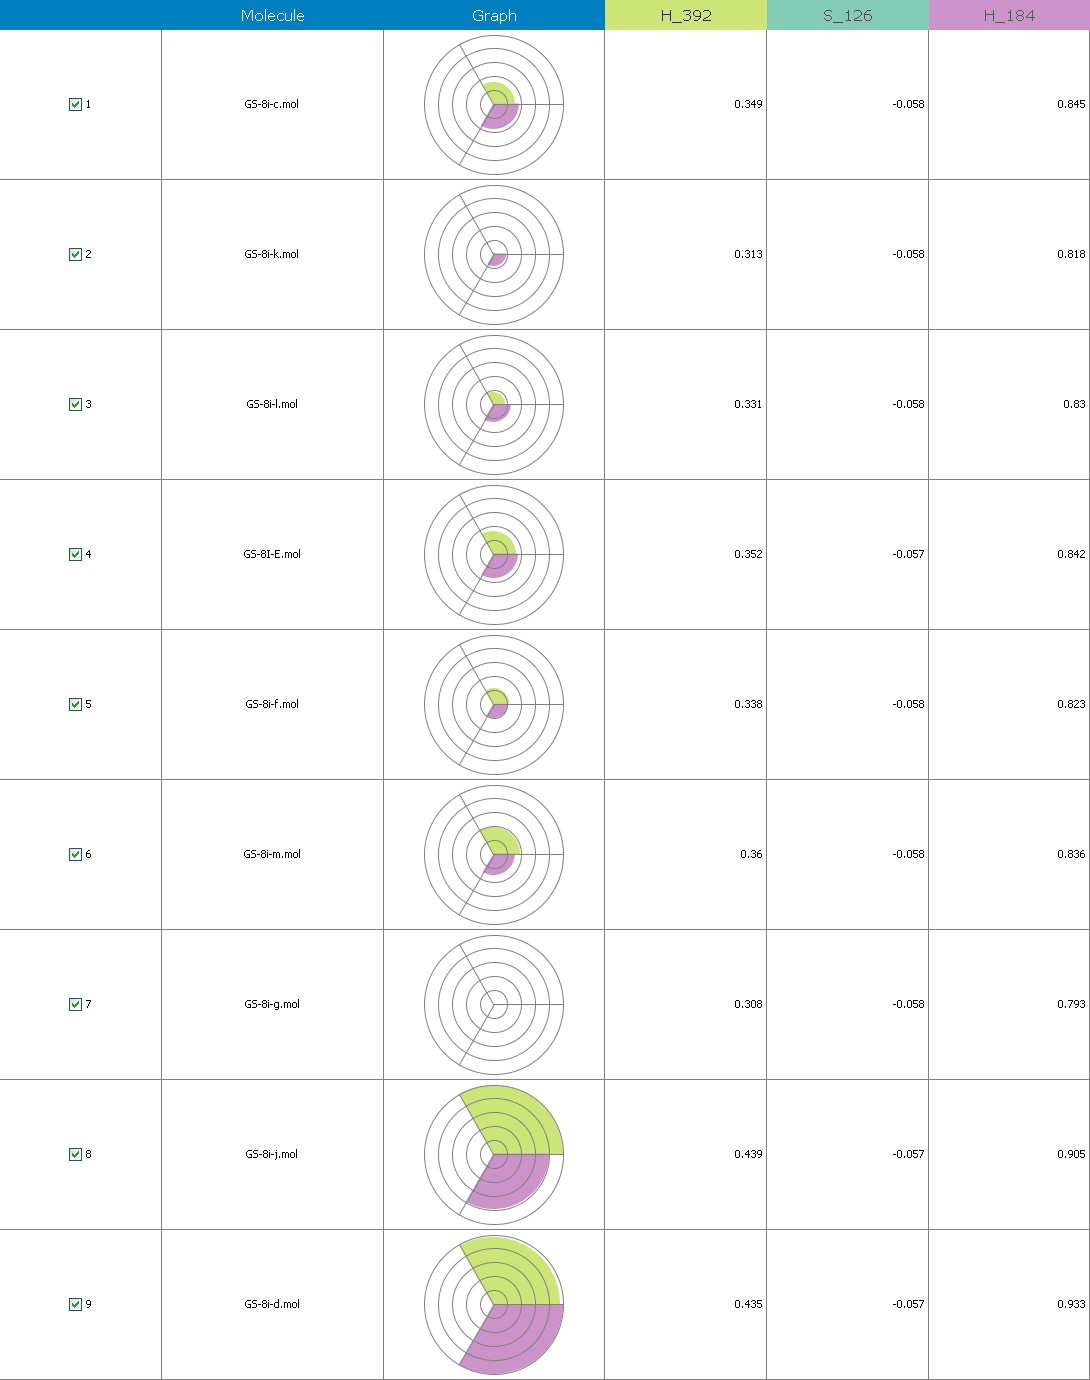
Fig.18 Descriptor participation Pi-graphs: GS 8ia to GS 8im
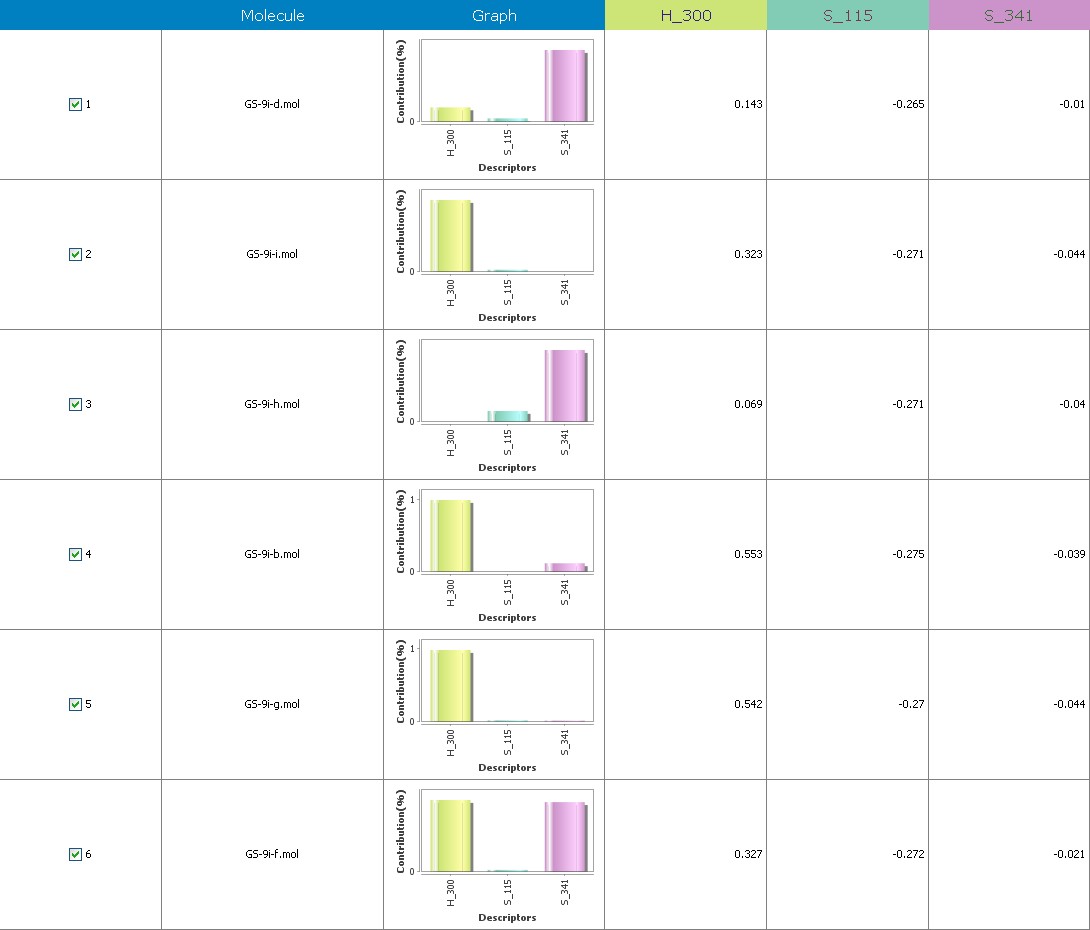
Fig.19 Descriptor participation graphs: GS 9ia to GS 9ii
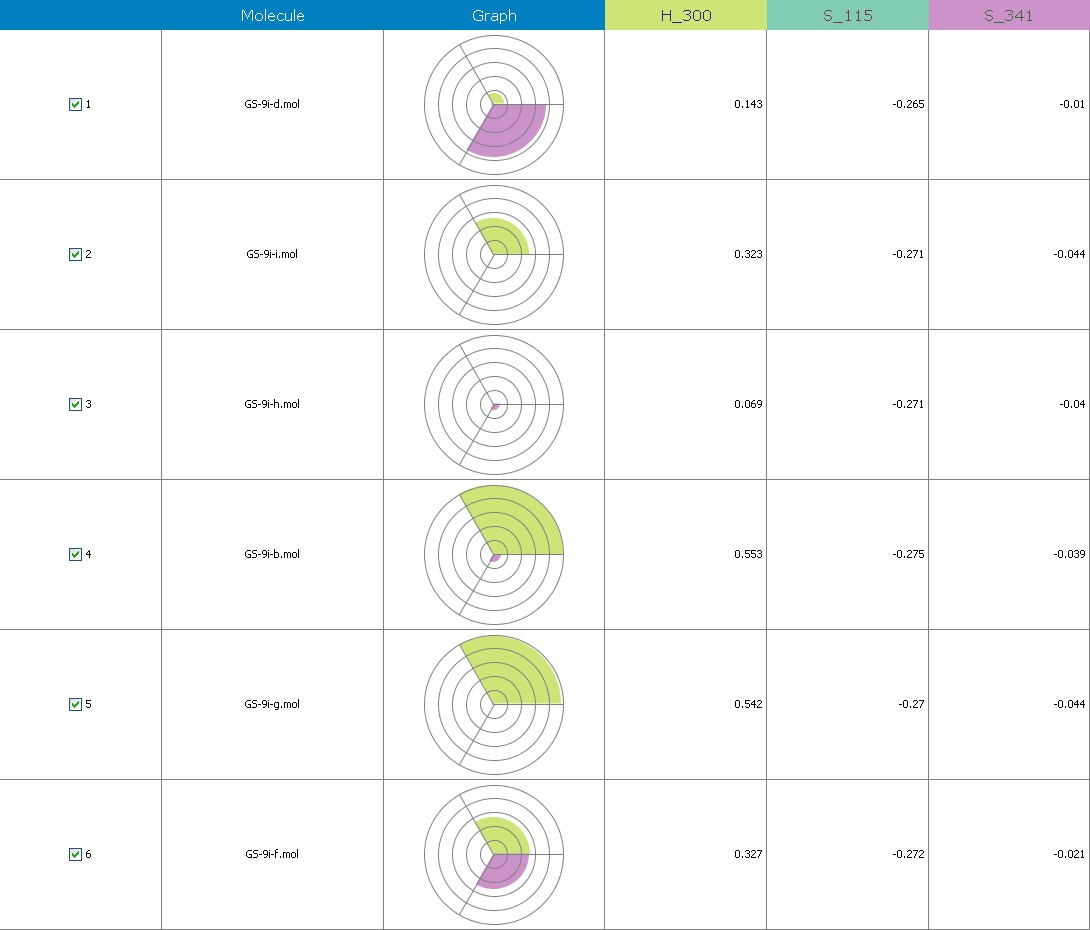
Fig.20 Descriptor participation Pi-graphs: GS 9i a to GS 9ii
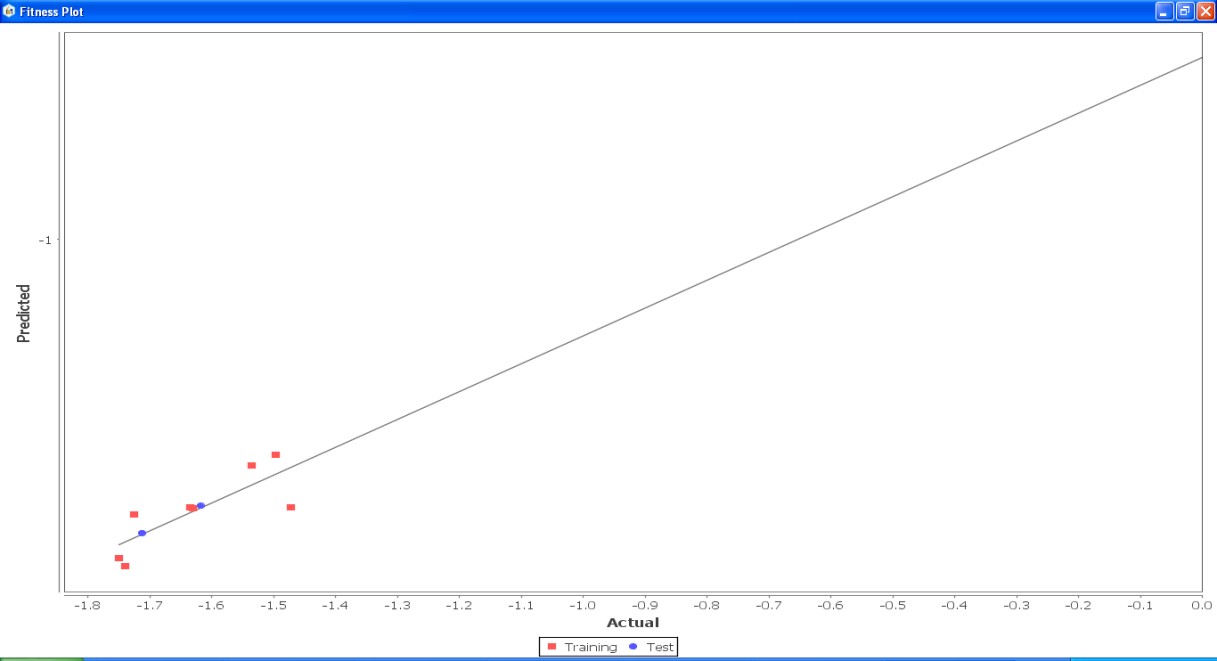
Fig. 21: Fitness graph comparing GS 1a – GS 1k between reported activity and expected activity
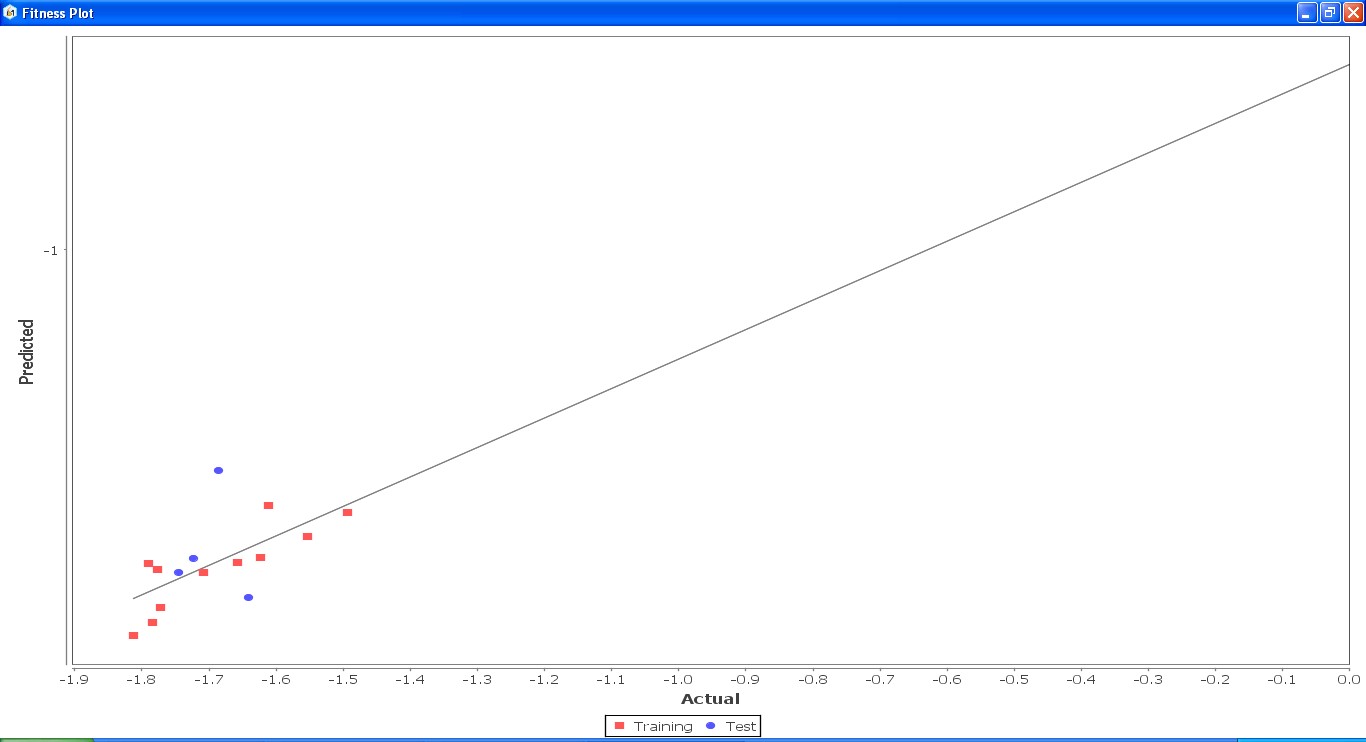
Fig. 22: Fitness graph comparing GS 2ia – GS 4c between reported activity and expected activity
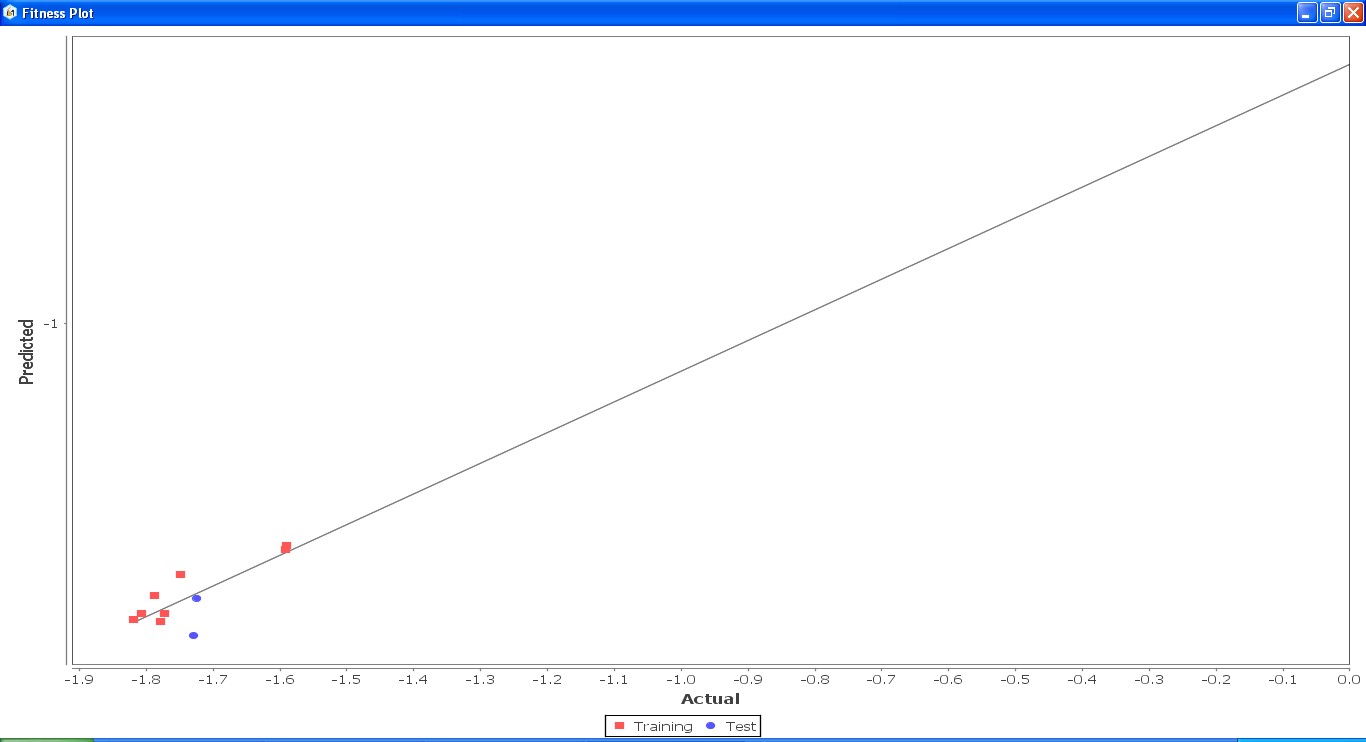
Fig. 23: Fitness graph comparing GS 5ia to GS 7id between reported activity and expected activity

Fig. 24: Fitness graph comparing GS 8ia to GS 8im between reported activity and expected activity
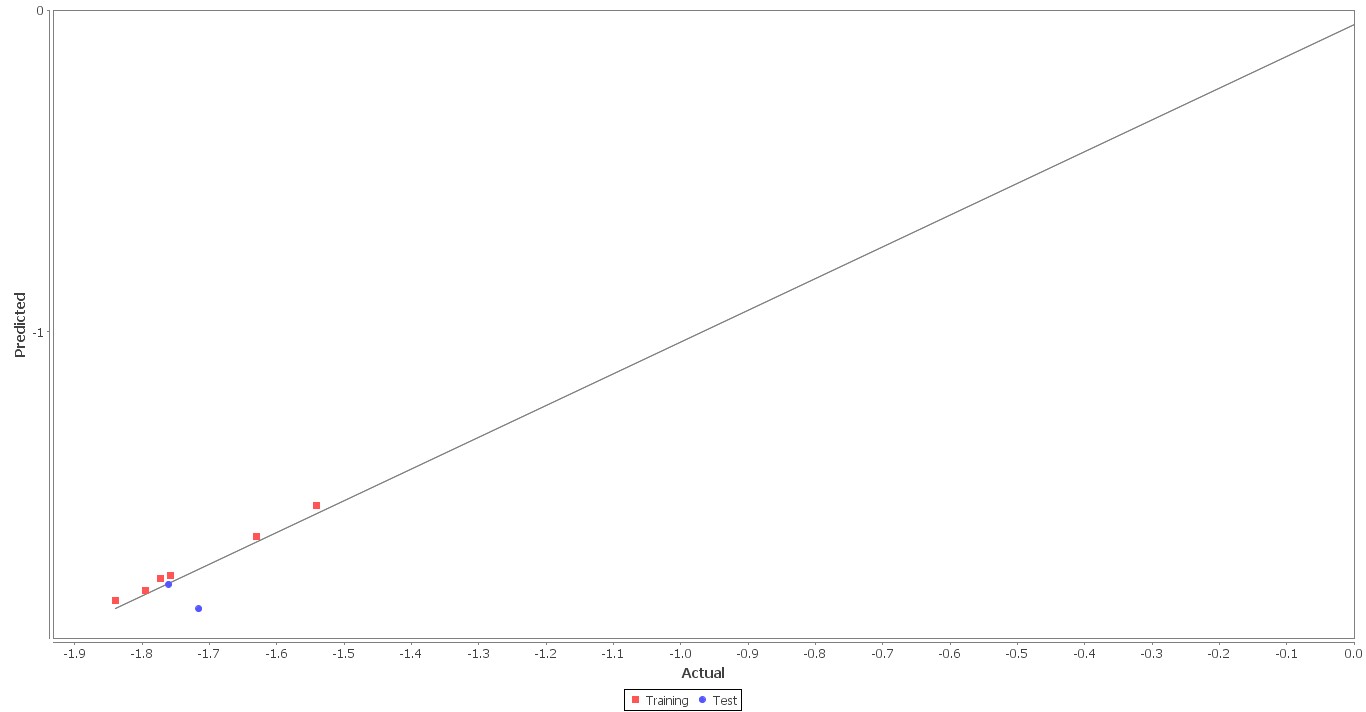
Fig. 25: Fitness graph comparing GS 9ia to GS 9iI between reported activity and expected activity
Conclusions
Equation-1 has an intrinsic predictive ability of 92 percent (q2) and an extrinsic predictive ability of 32 percent (pred r2se) and explains 98 percent (r2 = 0.64) of the training set’s dimensions total variance. The training set’s dimensions total variance is explained by the equation- 2 in 96 percent of cases (r2 = 0.69), and it also possesses intrinsic (q2) and extrinsic (pred r2se) predictive abilities of 92and 26 percent, respectively.
Equation-3 has intrinsic (q2) and extrinsic (pred-r2se) prediction abilities of 94% and 29%, respt., and demonstrate 97% (r2= 0.87) of the entirety variation in the training-set dimensions. By using the forward method, the descriptor extent is H-66, H-19, H-33, H-39, H-18, H-30, H-29 (0.44 to 0.45), which signifies that a smaller bulky substituent group is preferred in that area. +Ve hydrophobic descriptor range suggests that +Ve water-insoluble potential is favorable for extension in the antiplatelet activity.
The development of 2-Dimensional and 3-Dimensional QSAR models and equations with moderate-to-high thiazole derivatives prediction accuracy. Hydrophobicity’s significance as a 3-Dimensional feature was established, and it was discovered that electrostatic and steric impacts also support antioxidant action. The acquired models could aid in the development of novel active thiazoles with antioxidant properties.
Acknowledgments
The “Suresh Gyan Vihar University,” which provided the V-Life MDS software and more, is heartily appreciated by the writers. The principal of the institute is thanked by the authors for providing the resources needed to complete the study. The authors also acknowledge the researchers would like to thank whose insightful criticism and recommendations considerably enhanced the work.
REFERENCES
- Ajmani S, Jadhav K and Kulkarni SA. Three-dimensional QSAR using the k-nearest neighbor method and its interpretation. Journal of Chemical Information & Modeling 2006;46:24–31.
- Bhadoriya KS, Jain SV, Bari SB, Chavhan ML and Vispute KR. 3D-QSAR study of indol-2-yl ethanones derivatives as novel indoleamine 2, 3-dioxygenase (IDO) inhibitors. European Journal of Chemistry 2012;9:1753–59.
- Ivanka M. Tsakovska QSAR and 3D-QSAR of Phenothiazine Type Multidrug Resistance Modulators in P388/ADR Cells. Bioorganic & Medicinal Chemistry 2003;11:2889–99.
- Clark M, Cramer III RD, and Van ON, Validation of the general-purpose Tripose 5.2 force field. Journal of Computational Chemistry 1989;10:982– 1012.
- Cramer III RD, Patterson DE, and Bunce JD. Comparative molecular field analysis (CoMFA) 1. Effect of shape on binding of steroids to carrier proteins. Journal of American Chemical Society 1988;110:5959–67.
- Akira M, Masakazu S, Mari A, Makoto T. 2-Acylimino-3H-thiazoline Derivatives: A Novel Template for Platelet GPIIb/IIIa Receptor Antagonists. Bioorganic & Medicinal Chemistry Letters 2001;11:1031–35.
- Doweyko AM. QSAR: dead or alive? J Comput Aided Mol Des 2008;22:81–89.
- Yadav JS, Subba Reddy BV, Gopala Rao Y, Narsaiah AV. The first example of the coupling of a-diazo ketones with thiourea: a novel route for the synthesis of 2-aminothiazoles. Tetrahedron Letters 2008;49:2381–83.
- Gaurav A, Yadav MR, Giridhar R, Gautam V and Singh R. 3D-QSAR studies of 4-quinolone derivatives as high-affinity ligands at the benzodiazepine site of brain GABAA receptors. Medicinal Chemistry Res 2010; Available from URL: http://dx.doi.org/10.1007/s00044-010-9306-5.
- Ghosh P and Bagchi MC. QSAR modeling for quinoxaline derivatives using genetic algorithm and simulated annealing-based feature selection. Current Medicinal Chemistry 2009;16:4032–48.
- Halgren TA. Merck molecular force field: III. Molecular geometries and vibrational frequencies for MMFF94. Journal of Computational Chemistry 1996;17:553–86
- Hansch C. A quantitative approach to biochemical structure activity relationships. Account of Chemical Research 1969;2:232–39.
- Jain SV, Bhadoriya KS, and Bari SB. QSAR and flexible docking studies of some aldose reductase inhibitors obtained from natural origin. Medicinal Chemistry Research 2012;21:1665–76. Available from: URL: http://dx.doi.org/ 10.1007/s00044-011-9681-6.
- Jain SV, Ghate M, Bhadoriya KS, Bari SB, Chaudhari A, and Borse JS. 2D, 3D-QSAR and docking studies of 1,2,3-thiadiazole thioacetanilides analogues as potent HIV-1 non-nucleoside reverse transcriptase inhibitors. Organic Medicinal Chemistry Letters 2012;2:22. Available from: URL:http://dx.doi.org/10.1186/2191-2858-2-22.
- Nakka S and Guruprasad L. The imidazolidone analogs as phospholipase D1 inhibitors: analysis of the three-dimensional quantitative structure–activity relationship. Medicinal Chemistry Research 2012;21:2517–25. Available from: URL:http://dx.doi.org/10.1007/s00044-011-9773-3.
- Radhika V, Kanth SS and Vijjulatha M. CoMFA and CoMSIA studies on inhibitors of HIV-1 integrase-bicyclic pyrimidinones. Journal of Chemistry. 2010; 7(S1):S75–S84.
- Sahu NK, Bari SB and Kohli DV. Molecular modeling studies of some substituted chalcone derivatives as cysteine protease inhibitors. Medicinal Chemistry Research 2011; Available from URL: http://dx.doi.org/10.1007/s00044-011-9900-1.
- Scior T, Medina-Franco JLDoQT, Martinez-Mayorga K, Yunes Rojas JA, Bernard P. How to recognize and workaround pitfalls in QSAR studies: a critical review. Current Medicinal Chemistry 2009;16:4297–13.
- Sharma MC and Kohli DV. A comprehensive structure-activity analysis 2,3,5-trisubstituted 4,5-dihydro-4-oxo-3H-imidazo [4,5-c] pyridine derivatives as angiotensin II receptor antagonists: using 2D- and 3D-QSAR approach. Medicinal Chemistry Research 2012 Available from URL:http://dx.doi.org/10.1007/s00044-012-0040-z.
- Shen M, Xiao Y, Golbraikh A, Gombar VK and Tropsha A. An in silico screen for human S9 metabolic turnover using KN nearest neighbor QSPR method. Journal of Medicinal Chemistry 2003;46:3013–20.
- Tanneeru K, Reddy BM and Guruprasad L. Three-dimensional quantitative structure–activity relationship (3D-QSAR) analysis and molecular docking of ATP-competitive triazine analogs of human mTOR inhibitors. Med. Chem. Res. 2011; Available from: URL: http://dx.doi.org/10.1007/s00044-011-9629-x.
- VLife MDS 3.5, Molecular Design Suite. Vlife Sciences Technologies Pvt. Ltd. Pune. 2010.
- Zheng W and Tropsha A. Novel variable selection quantitative structure-property relationship approach based on the k-nearest neighbor principle. Journal of Chemistry Information and Computer Science 2000;40:185–94.
- Mukesh CS, Kohli DV. Insight into the structural requirement of aryltriazolinone derivatives as angiotensin II AT1 receptor: 2D and 3D-QSAR k-Nearest Neighbor Molecular Field Analysis approach. Medicinal Chemistry Research 2012;21(10):2837-53.
- Verma J, Khedkar VM. 3D-QSAR in drug design–a review. Current topics in medicinal chemistry 2009;10(1):95-115.